
During my holiday I was writing a small tool for fun, which extracts my personal posts from http://www.baidu.com for further analysis. I am using AJAX in jQuery to perform a synchronous call to fetch html source code of given url specified by argument requestURL.、
function getPostByAJAX(requestURL){
   var html = $.ajax({
    url: requestURL,
    async: false}).responseText;
   return html;
}
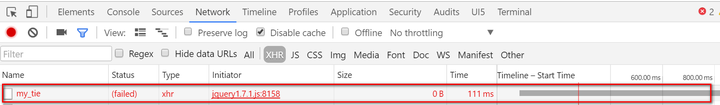
The requestURL I am using is http://tieba.baidu.com/i/i/my_tie

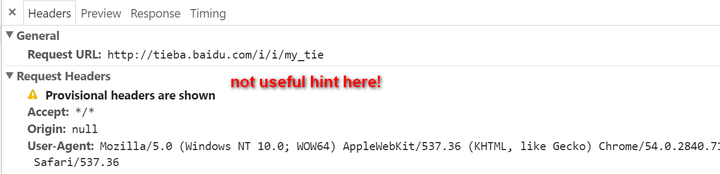
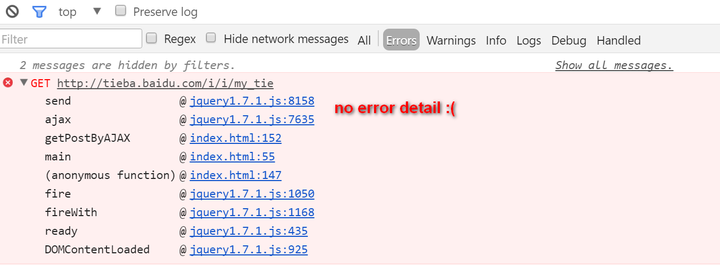
However when I try to access it via my JavaScript code above, it failed. And Chrome development tool didn’t give me enough information for trouble shooting.
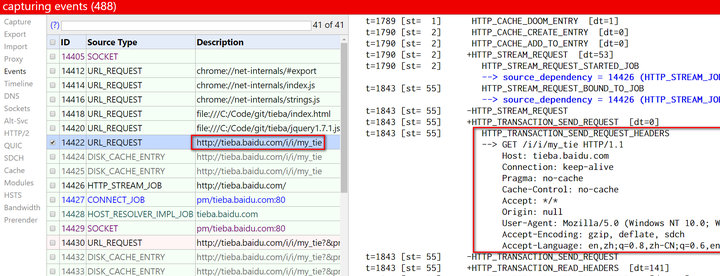
How to deal with this issue then? Then I found the useful tool from Google: chrome://net-internals Now let’s continue to trouble shoot with this tool.
(1) type chrome://net-internals in Chrome address bar, press enter key. Then click Event hyperlink.

(2) Go to my own html page which will send AJAX request via jQuery, click F5 to send a new request, then go back to Chrome tool. Now I have found the trace entry for the sent request. Here below is the request detail which contains much more information compared with the one in Chrome development Tool-Network tab.
And here below are response header fields:
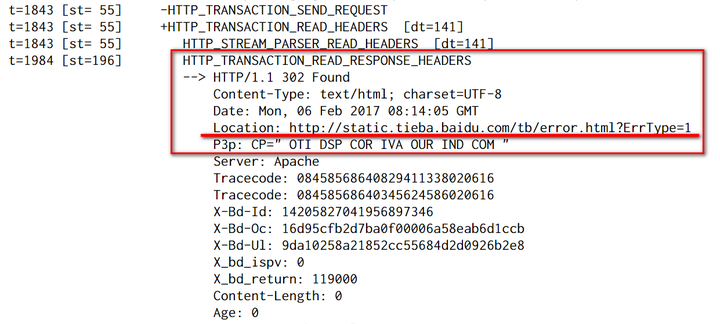
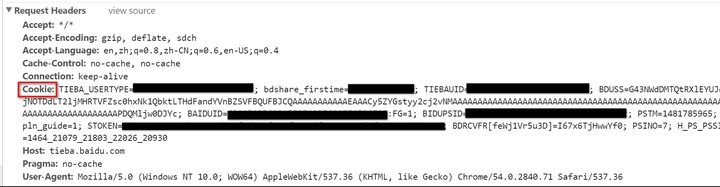
The return code 302 and location “http://static.tieba.baidu.com/tb/error.html?ErrType=1” give me a reminder that this issue might be related to logon state of BAIDU website, since I would like to return my personal information, it makes sense that the url can only return personal data if cookie is available or user credential is specified ( not supported by BAIDU in this case ). In order to verify my assumption, I request the url directly in Chrome and check its request header fields this time, and yes, the cookie field is there:
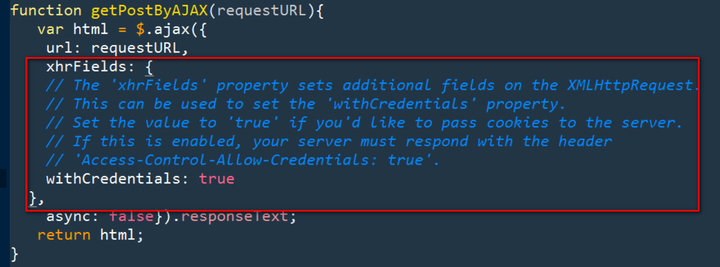
So now the question is, how to send my cookie information together with the AJAX call in JavaScript code? I found this article from Google. According to the article, I add the following code in my function:
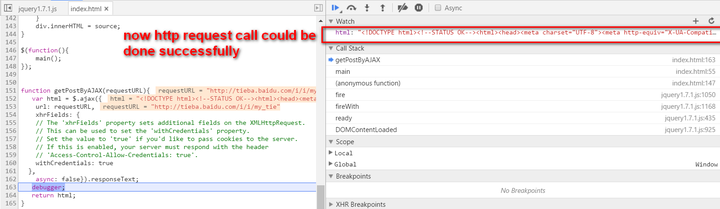
And it works now:
By the way, via this tool I can also figure out how the jQuery library file jquery1.7.1.js stored in local laptop is loaded by Chrome. Chrome reads this file by chunks with size 32768 ( the file consists of 8 chunks ).
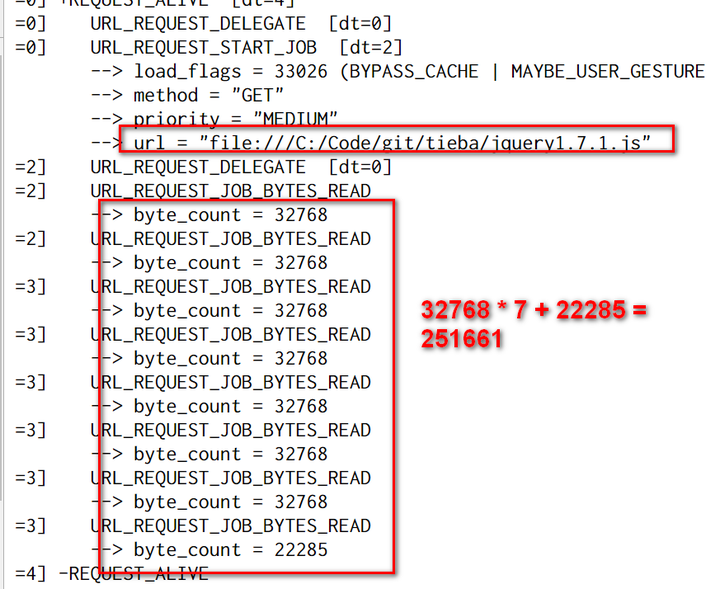
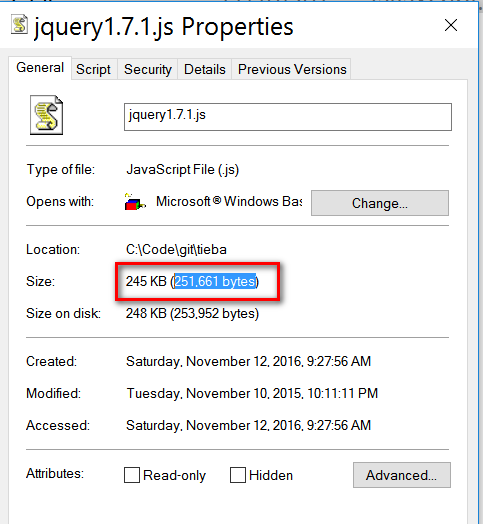
The total size 251661 matches exactly with the number I see in windows, perfect isn’t it?
Further reading
For more tips I gained during my daily work about Chrome development tools, please refer to this blog Chrome Development Tool tips used in my daily work.
要获取更多Jerry的原创文章,请关注公众号"汪子熙":


相关推荐
打开Chrome开发者工具,选择Element面板。 2. 在页面中点击想要修改样式的元素。 3. 在Element面板中找到对应的DOM元素。 4. 修改元素的CSS属性,如`width`、`color`等,观察页面实时变化。 #### 网络性能优化 ...
调试基于WebView的App最舒服的工具Chrome自带的开发者工具,其中有我们熟悉的Dom树调试,JS调试,Network监视等等功能。 Google提供的调试Android上WebView的步骤: 1.开启手机上的USB调试功能并且连接计算机手机端...
调试WebRTC应用通常需要使用Chrome开发者工具中的`chrome://webrtc-internals`页面,它提供了详细的日志和统计信息。 在这个"webRTC调用本地摄像头demo"中,开发者通过一系列WebRTC API和HTML5特性,实现了一个简单...
- **depot_tools**:这是Google的一个工具集合,包含了用于获取和构建开源项目的工具,如Git、GYP等。在WebRTC开发中,它用于管理依赖和构建过程。 - **Gyp工具**:GYP(Generate Your Project)是Google开发的跨...
【标题】"View Browser Bluetooth Internals-crx插件"是一个专为谷歌Chrome浏览器设计的扩展工具,它允许用户便捷地访问浏览器的蓝牙内部设置页面。这个插件的主要目的是提供一个直接通道,让用户能够深入探索和管理...
1. 单元测试:可以使用WebRTC测试工具如webrtc-internals或chrome://webrtc-internals来检查连接状态、音频视频流质量等。 2. 功能测试:邀请另一人加入同一会议室,进行音视频通话,观察是否能正常收发音视频。 ...
学习WebRTC不仅需要了解其技术细节,还应熟悉相关的调试工具,如Chrome开发者工具中的“设备”和“网络”面板,以及webrtc-internals页面,它们可以帮助开发者理解和解决在开发过程中遇到的问题。 9. **实际应用**...
"View Browser Blob Internals-crx插件"是一个专为Google Chrome浏览器设计的扩展程序,其主要功能是帮助用户快速访问和查看Chrome浏览器中的Blob内部页面。Blob内部页面通常包含浏览器处理和存储的二进制数据细节,...
"webrtc-demo-master.zip"是一个包含WebRTC音频示例项目的压缩包,专为在Linux环境下运行设计。这个项目可能是为了帮助开发者快速理解和实践WebRTC的基本音频功能。 首先,我们要理解WebRTC的核心组件。它包括: 1....
另外,`chrome://webrtc-internals/`页面提供了详细的调试信息,帮助开发者理解WebRTC内部的工作流程。 七、安全性与隐私 WebRTC遵循安全原则,所有通信都是加密的。DTLS(Datagram Transport Layer Security)用于...
net-internals事件查看器和相关功能已从Chrome中删除,因此此扩展程序可以显示使用chrome:// net-export原始项目创建的NetLog转储:https://chromium.googlesource.com/catapult/+/master/ netlog_viewer / ...
开发者可以借助各种工具,例如Chrome开发者工具中的"Media"面板,用于查看音视频流的质量和性能;或者使用webrtc-internals页面查看WebRTC内部的详细统计数据。 在提供的压缩包文件中,虽然没有具体的源代码或文档...
这个“webrtc最新源码”压缩包包含的就是WebRTC项目的最新源代码,可以从官方同步获取,这为开发者提供了深入理解、定制和优化WebRTC功能的机会。 1. **WebRTC的基本构成**: WebRTC由一系列库和API组成,包括音...
"NodeJS-Nucleus-Plus-Internals-master"可能是一个关于Node.js内核扩展或优化的项目。Nucleus Plus可能是在Node.js原生架构基础上添加了额外功能或性能优化的库。通常,这样的项目会深入到Node.js的底层,对事件...
WebRTC提供了`getStats()` API,它是RTCPeerConnection对象的一个方法,用来获取各种统计信息。调用这个方法可以获取到连接的详细报告,然后遍历并处理每个报告,例如: ```javascript var pc = new ...
开发过程中,可以使用Chrome开发者工具中的Webrtc-internals页面来监控WebRTC的内部状态,帮助诊断和优化性能问题。 综上,"WebRTC发布.framework.zip"是一个包含WebRTC iOS框架的压缩包,开发者可以通过它在iOS...
- **快速访问**:此插件提供了一个便捷的入口,用户无需通过复杂的设置菜单或开发者工具就能直接查看Chrome的应用程序缓存页面。 - **查看详细信息**:用户可以查看缓存的文件列表,了解哪些资源已被存储,大小、...
8. **调试与测试**: 开发WebRTC应用时,开发者工具如Chrome的webrtc-internals可以帮助监控和调试连接状态,而testrtc.org等在线测试工具可以用来检测兼容性和性能问题。 这个"videochat-example-110723"压缩包可能...
在IT领域,CEFSharp是一个非常重要的库,它允许开发者在.NET环境中嵌入Chromium浏览器引擎。这个库使得在Windows Forms或WPF应用中创建自定义的浏览器控件成为可能,同时支持JavaScript与C#之间的交互。本文将深入...
6. **调试与优化**:利用Chrome开发者工具中的`chrome://webrtc-internals`页面,可以查看WebRTC连接的详细状态,有助于定位问题并进行性能优化。 通过这个"WebRTCSetup"项目,你将能够深入理解WebRTC的工作原理,...