http://www.sitepoint.com/debugging-and-profiling-php-with-xdebug/
PHP is the most popular language for web development, but a common criticism against it used to be that it lacked a suitable debugger. Developers using languages like Java and C# enjoy a powerful suite of debugging tools, often integrated directly with their IDEs. But the disconnected nature of web servers and PHP IDEs prevented us from having many of the same tools available. We manually added debug statements in our code… until Xdebug filled the void.
Xdebug is a free and open source project by Derick Rethans and is probably one of the most useful PHP extensions. It provides more than just basic debugging support, but also stack traces, profiling, code coverage, and so on. In this article you’ll see how to install and configure Xdebug, how to debug your PHP application from Netbeans, and how to read a profiling report in KCachegrind.
Installing and Configure Xdebug
If you are using XAMPP or MAMP, Xdebug comes preinstalled; you just need to enable it in your php.ini. If you are using a package based installation on a platform such as Ubuntu, you can install it through your package manager with a command like apt-get install php5-xdebug.
The entries for Xdebug in my php.ini look like this:
[xdebug]
zend_extension="/Applications/MAMP/bin/php5.2/lib/php/extensions/no-debug-non-zts-20060613/xdebug.so"
xdebug.remote_enable=1
xdebug.remote_host=localhost
xdebug.remote_port=9000
zend_extension specifies the path to the Xdebug module. The xdebug.remote_enable value toggles whether the extension is active or not. xdebug.remote_host is the name or the IP address of your system (here I’ve specified localhost because I’m working all on the same machine, but the value can be an IP Address or a DNS hostname if you need to specify something different for your setup). xdebug.remote_port is the port on which the client listens for a connection from Xdebug (9000 is the default value).
When you use Xdebug, it’s important to make sure you are not using any other Zend extensions since they may conflict with Xdebug.
There are other installation options as well. The Xdebug website provides a simple wizard to guide you through installation. You can take the output of phpinfo() or php –i and paste it in the text box and have the wizard analyze your server’s configuration and instruct you on how to compile Xdebug for your machine.
Debugging
More often than not it’s tempting to use the var_dump() and exit/die() combination for debugging. But the problem with this approach is that you have to modify the code for debugging; you must remember every place you added output statements and remove them after debugging is finished. Xdebug overcomes this by letting you pause your application’s execution where ever you want. Then you can inspect the variables’ values in that scope to get better insight into what PHP is doing.
You can easily configure Netbeans to act as an Xdebug client. Open the options window (Tools > Options) and go to the debugging tab for the PHP section. Enter the debugging port given in php.ini and a Session ID which you’ll need to pass with the requests you want to debug. Now you’ll be able to run the debugger by clicking Debug in the tools tab.
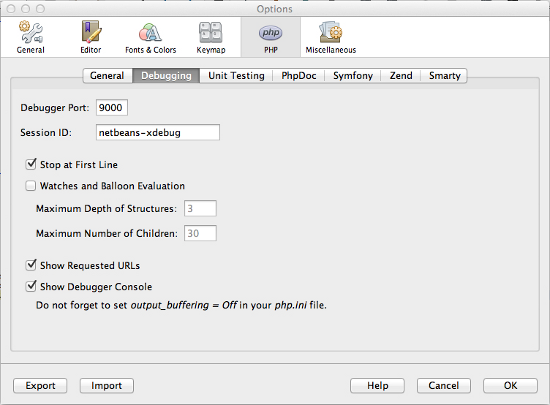
With your source file open, press the Debug button in the toolbar to start debugging. It will open up the application in a browser, and PHP’s execution will pause at the first line of the file if you have enabled the “Stop at first line” option in the Options window. Otherwise, it will run until it encounters the first breakpoint. From there you can continue to the next break point using the continue button.
Notice in the brower’s URL bar the XDEBUG_SESSION_START parameter. To trigger the debugger you must pass XDEBUG_SESSION_START as a request parameter (GET/POST) or XDEBUG_SESSION as a cookie parameter.
There are some other useful actions in the debugging toolbar. They are:
- Step over – Step over the currently executing line
- Step into – Step into the function (for non-built-in functions)
- Step out – Step out of the current function
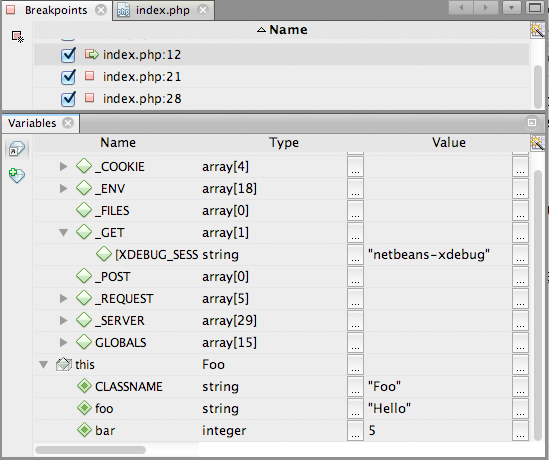
You can add breakpoints by clicking the line number in the editor’s margin and then pause execution on them. They can be removed by clicking on them again. Alternatively, go to Window > Debugging > Breakpoints which will list all breakpoints in your program and you can select/deselect only those you needed.
While running, the state of the variables in the current scope are shown in the variables window. It will show the values of local variables and super global variables like $_COOKIE, $_GET, $_POST and $_SERVER. You can watch their values change as you step through through the statements.
Profiling
Profiling is the first step when optimizing any application. Profiling tools record important details like the time it takes for statements and functions to execute, the number of times they are called, and so on. The output can be analyzed to understand where the bottlenecks are.
Xdebug can also be used as a profiling tool for PHP. To start profiling your applications, add the following settings to php.ini:
xdebug.profiler_enable = 1
xdebug.profiler_output_name = xdebug.out.%t
xdebug.profiler_output_dir = /tmp
xdebug.profiler_enable_trigger = 1
Profiling is disabled by default in Xdebug, so xdebug.profiler_enable is used to enable it. xdebug.profiler_output_name is the filename of the profiler log (the %t specifier appends a timestamp to the filename; see the documentation for a full list of specifiers). Xdebug stores the profiling output in the directory specified by xdebug.profiler_output_dir. You can can change this to a location of your choice, but remember it must have write permissions for the user account under which the PHP script is run.
Profiling degrades performance since the PHP engine need to look af each function call and log its details, so you don’t want to run it all the time. xdebug.profiler_enable_trigger instructs Xdebug to perform profiling only when XDEBUG_PROFILE is passed as a GET or POST parameter.
The log file created by Xdebug can be small or large depending on what the application is doing. Also, it’s not really reader friendly. You’ll want to use programs like KCachegrind or Webgrind to view them. KCachegrind is a profile data visualization tool for KDE, which needs a Unix environment to run, whereas Webgrind is a web-based tool.
Opening the profiling long file in KCachegrind will show the cost of each function call starting at main(). Here is the KCachegrind visualization of profiling output of a function to find a factorial:
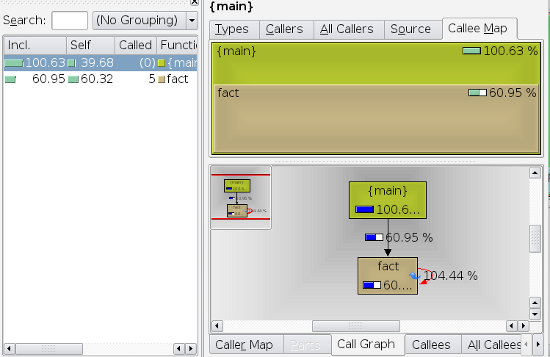
The left side panel (Function Profile) shows the time taken by each function in their execution order. The top right panel graphically displays the same information with the size corresponding to the cost of the function. The call graph represents the relationship between functions in the application. In this example there are only two functions, main() and fact(). fact() is a recursive function, which is indicated using a cycle in the graph.
While optimizing your code, you should look for the areas with highest total cost. More often than not, I/O operations will have the highest cost. Remember to reduce them as much as possible. Lazy load files wherever that makes sense.
Suppose you have a class named Orders which will give you a list of all orders and their details from your web store.
|
1
2
3
4
5
6
7
8
9
10
11
12
13
14
15
16
17
18
19
20
21
22
23
24
25
26
27
28
29
30
31
|
<?phpclass Orders
{ protected $db;
public function __construct(PDO $db) {
$this->db = $db;
}
public function getAll() {
$orders = array();
$query = "SELECT * FROM orders";
$result = $this->db->query($query);
while ($row = $result->fetch(PDO::FETCH_ASSOC)) {
$row['details'] =
$this->getDetails($row['orderId']);
$orders[] = $row;
}
return $orders;
}
public function getDetails($orderId){
$details = array();
$result = $this->db->query("SELECT * FROM orderdetails WHERE orderId = " . $orderId);
while ($row = $result->fetch(PDO::FETCH_ASSOC)) {
$details[] = $row;
}
return $details;
}
} |
This class has two methods: getAll() and getDetails(). When you call the getAll() method, it will get all of the records from the orders table and loop through them to get the details of all records.
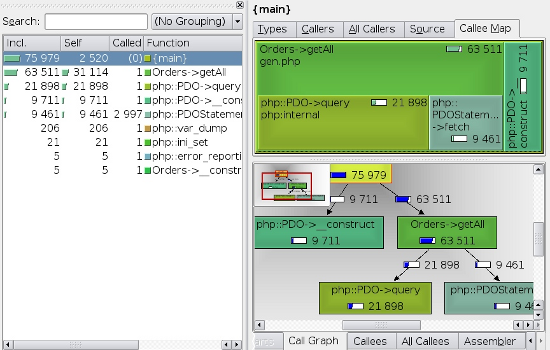
Let’s have a look at the profiling information.
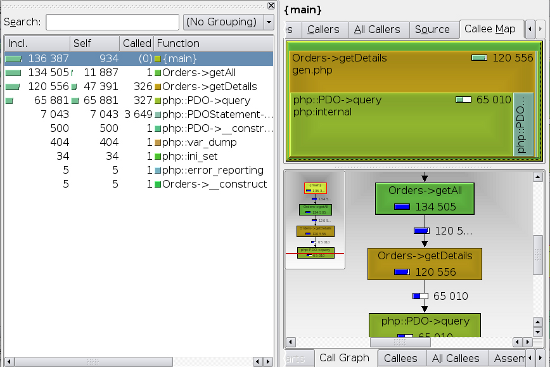
Though the absolute figures are not significant since they depend on the platform and runtime conditions, you will get an idea about relative cost of different functions. Notice that some functions are called hundreds of times (which is bad of course). The code doesn’t need to loop through all of the orders and get the details of each order individually. Let’s rewrite the getAll() function to use a JOIN instead.
|
1
2
3
4
5
6
7
8
9
10
11
12
13
|
<?phppubilc function getAll() {
$orders = array();
$query = "SELECT * FROM orders o
JOIN orderdetails d ON o.orderId = od.Id
ORDER BY o.orderId
";
$result = $this->db->query($query);
while($row =$result->fetch(PDO::FETCH_ASSOC)){
$orders[] = $row;
}
return $orders;
} |
Now the profiling yields a better result since the number of queries has decreased. Also, the code isn’t calling the getDetails() function any more.
Summary
Xdebug act as a middleman that controls the execution of PHP programs in the server. In this article you’ve seen two of the most impressive features of Xdebug – debugging support and profiling support.
Its remote debugging allows you to inspect values at runtime, without modifying your program, to get a better understanding of what PHP is doing. Profiling helps uncover bottlenecks in your code so you can optimize it for better performance.
I hope this article helps you realize the benefits of Xdebug and encourages you to start using it right away if you aren’t already. And if you find this a valuable tool, you might even want to consider supporting this great project by buying a support agreement.


相关推荐
A must have for everyone thats debugging, profiling and tracing PHP code with Xdebug. This extension will help you to enable/disable debugging, profiling and tracing easily, instead of juggling around...
USB调试和分析技术是嵌入式系统开发领域中的关键技术之一,尤其是在使用通用串行总线(USB)接口的设备上。USB接口由于其使用方便、支持热插拔、传输速度快、可靠性高和可以通过总线供电等特点,在嵌入式空间中得到...
有完整的截图,希望可以给需要的人帮助
Linux Debugging and Performance Tuning (Prentice, 2005)
This is the Tenth Edition, of Debugging with GDB: the GNU Source-Level Debugger for GDB (GDB) Version 8.1.90.20180814-git. Copyright © 1988-2018 Free Software Foundation, Inc. Permission is granted...
"Linux Debugging and Performance Tuning Tips and Techniques"这个压缩包文件显然是为了帮助用户掌握这些技能而设计的。这里,我们将深入探讨其中可能包含的一些关键知识点。 **Linux Debugging** 1. **日志分析*...
Debugging Mac OSX Applications with IDA Pro, 2020最新版本,非常详细,enjoy it!
根据提供的信息,我们可以总结并详细解释与“debugging_with_gdb(中文版pdf)”相关的知识点。这份文档似乎是一份关于使用 GDB(GNU Debugger)进行调试的手册或指南的中文版 PDF 文件。GDB 是一个非常强大的开源调试...
《Apple Debugging and Reverse Engineering V3.0》是一本深入探讨苹果系统调试和逆向工程的资源合集,包括PDF和epub格式的电子书,以及可能附带的代码示例。这本书旨在帮助读者提升使用LLDB(LLVM Debugger)进行...
### Linux调试与性能调优技巧和技术 #### 一、概览 《Linux调试与性能调优:技巧和技术》是一本全面介绍如何在Linux系统中进行软件调试和性能优化的专业书籍。作者Steve Best凭借其在IBM丰富的Linux系统优化经验,...
Linux调试技术和性能调优手段,chm格式
《Windows Embedded CE 6.0调试与性能分析详解》 Windows Embedded CE 6.0是微软推出的一款嵌入式操作系统,广泛应用于各种设备和嵌入式系统中。在开发和优化这类系统的流程中,调试与性能分析是至关重要的环节。...
Debugging With GDB 英文无水印pdf pdf所有页面使用FoxitReader和PDF-XChangeViewer测试都可以打开 本资源转载自网络,如有侵权,请联系上传者或csdn删除 本资源转载自网络,如有侵权,请联系上传者或csdn删除
Inside Windows Debugging - Practical Debugging and Tracing Strategies 英文无水印pdf pdf所有页面使用FoxitReader和PDF-XChangeViewer测试都可以打开 本资源转载自网络,如有侵权,请联系上传者或csdn删除 ...
### PDT与Xdebug搭建PHP开发调试环境 #### 一、安装与配置 ##### 1.1 首先下载并安装相应软件 为了能够顺利地使用PDT与Xdebug搭建PHP开发调试环境,你需要准备以下几个组件: - **JDK**:Java Development Kit,...
This book is for intermediate to advanced iOS/macOS developers who are already familiar with either Swift or Objective-C and want to take their debugging skills to the next level. Topics Covered in ...
Written by leaders in the parallel computing and OpenCL communities, this book explores memory spaces, optimization techniques, extensions, debugging and profiling. Multiple case studies and examples...
《Linux调试与性能优化》是针对Linux系统进行故障排查和性能提升的重要参考资料。...文档《Linux Debugging and Performance Tuning》将详细讲解这些内容,对于系统管理员、开发者和Linux爱好者来说是一份宝贵的资源。
Debugging iOS Applications with IDA Pro, 最新版本,enjoy it
Software Development, Design and Coding With Patterns, Debugging, Unit Testing, and Refactoring 英文epub 本资源转载自网络,如有侵权,请联系上传者或csdn删除 查看此书详细信息请在美国亚马逊官网搜索...