- жµПиІИ: 448427 жђ°
- жАІеИЂ:

- жЭ•иЗ™: иЛПеЈЮ
-

жЦЗзЂ†еИЖз±ї
- еЕ®йГ®еНЪеЃҐ (153)
- Hibernate (7)
- зЉЦз®ЛжАЭжГ≥ (9)
- Spring (5)
- жХ∞жНЃеЇУ (8)
- log4j (1)
- зљСзїЬеЃЙеЕ® (5)
- жАІиГљдЉШеМЦ (13)
- javaеЕґеЃГеЇФзФ® (23)
- еБЪдЇЛ?еБЪдЇЇеЕИ (19)
- javascript (5)
- Web Service (6)
- GWT-ext (3)
- java URL (0)
- javaзЫСжОІжКАжЬѓ (5)
- дЄ™дЇЇењГжГЕпЉМзїЩиЗ™еЈ±зХЩдЄАдЄ™еЃБйЭЩзЪДз©ЇйЧі (2)
- зЊОеЈ• (1)
- жИСзЪДзњїиѓС (1)
- english study (1)
- javaжЮґжЮД (4)
- иЗ™еЈ±еЗЇйЭҐиѓХйҐШ (3)
- Socket & е§ЪзЇњз®Л (1)
- йЂШзЇІињЫйШґ (0)
- е§ІжХ∞жНЃ (1)
з§ЊеМЇзЙИеЭЧ
- жИСзЪДиµДиЃѓ ( 0)
- жИСзЪДиЃЇеЭЫ ( 378)
- жИСзЪДйЧЃз≠Ф ( 8)
е≠Шж°£еИЖз±ї
- 2016-05 ( 4)
- 2014-05 ( 1)
- 2014-04 ( 2)
- жЫіе§Ъе≠Шж°£...
жЬАжЦ∞иѓДиЃЇ
-
danStartпЉЪ
жГ≥йЧЃйЧЃпЉМиГљзЫСжµЛжЬНеК°жШѓеР¶жМВжОЙеРЧпЉЯ
еЕђеПЄи¶Бж±ВеЃЮжЧґзЫСжОІжЬНеК°еЩ®пЉМеЖЩдЄ™WebзЪДзЫСжОІз≥їзїЯ -
hepctпЉЪ
дљ†е•љпЉМжЬАињСеЬ®жР≠дЄАдЄ™жЄЄжИПжЬНеК°еЩ®пЉМиГљеК†е•љеПЛиѓЈжХЩдЄЛеРЧпЉЯ1538863 ...
javaжЄЄжИПжЬНеК°зЂѓеЃЮзО∞ -
LimewwyпЉЪ
ж≤°жЙУеЃМе∞±еПСи°®дЇЖпЉЯдЄЇеХ•и¶БињЩж†ЈиЃЊзљЃпЉЯгАРжЄЄжИПдЄ≠йЬАи¶БдЉ†йАТзФ®жИЈзЪДзІѓеИЖпЉМињЩ ...
javaжЄЄжИПжЬНеК°зЂѓеЃЮзО∞ -
LimewwyпЉЪ
ж•ЉдЄїжВ®е•љгАВиѓЈжХЩдЄЇеХ•и¶БињЩж†ЈиЃЊиЃ°пЉЯ
javaжЄЄжИПжЬНеК°зЂѓеЃЮзО∞ -
3849801пЉЪ
ж•ЉдЄїпЉМиГље§ЯжПРдЊЫжЫіеЕЈдљУзЪДжЦЗж°£жИЦиАЕжМЗеѓЉеРЧпЉЯжИСжГ≥жР≠еїЇдЄАдЄ™жЬНеК°зЂѓпЉМйЭЮеЄЄ ...
javaжЄЄжИПжЬНеК°зЂѓеЃЮзО∞
ж†ЗзЇҐ
зЪДжШѓйЩМзФЯеНХиѓН
The Anatomy of a Whale
Sometimes it's really hard to figure out what's causing problems in a web site like Twitter. But over time we have learned some techniques that help us to solve the variety of problems that occur in our complex web site.
A few weeks ago, we noticed something unusual: over 100 visitors to Twitter per second saw what is popularly known as "the fail whale". Normally these whales are rare; 100 per second was cause for alarm. Although even 100 per second is a very small fraction of our overall traffic, it still means that a lot of users had a bad experience when visiting the site. So we mobilized a team to find out the cause of the problem.
What Causes Whales?
What is the thing that has come to be known as "the fail whale"? It is a visual representation of the HTTP "503: Service Unavailable" error. It means that Twitter does not have enough capacity to serve all of its users. To be precise, we show this error message when a request would wait for more than a few seconds before resources become available to process it. So rather than make users wait forever, we "throw away" their requests by displaying an error.
This can sometimes happen because too many users try to use Twitter at once and we don't have enough computers to handle all of their requests. But much more likely is that some component part of Twitter suddenly breaks and starts slowing down.
Discovering the root cause can be very difficult because Whales are an indirect symptom of a root cause that can be one of many components. In other words, the only concrete fact that we knew at the time was that there was some problem, somewhere. We set out to uncover exactly where in the Twitter requests' lifecycle things were breaking down.
Debugging performance issues is really hard. But it's not hard due to a lack of data; in fact, the difficulty arises because there is too much data. We measure dozens of metrics per individual site request, which, when multiplied by the overall site traffic, is a massive amount of information about Twitter's performance at any given moment. Investigating performance problems in this world is more of an art than a science. It's easy to confuse causes with symptoms and even the data recording software itself is untrustworthy.
In the analysis below we used a simple strategy that involves proceeding from the most aggregate measures of system as a whole and at each step getting more fine grained , looking at smaller and smaller parts.
How is a Web Page Built?
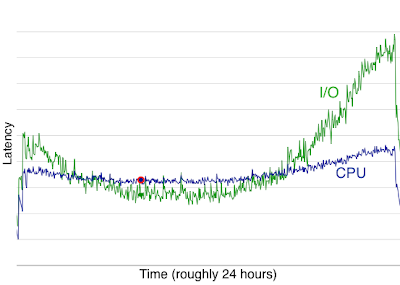
Composing a web page for Twitter request often involves two phases. First data is gathered from remote sources called "network services". For example, on the Twitter homepage your tweets are displayed as well as how many followers you have. These data are pulled respectively from our tweet caches and our social graph database, which keeps track of who follows whom on Twitter. The second phase of the page composition process assembles all this data in an attractive way for the user. We call the first phase the IO phase and the second the CPU phase. In order to discover which phase was causing problems, we checked data that records what amount of time was spent in each phase when composing Twitter's web pages.
The green line in this graph represents the time spent in the IO phase and the blue line represents the CPU phase. This graph represents about 1 day of data. You can see that the relationships change over the course of the day. During non-peak traffic, CPU time is the dominant portion of our request, with our network services responding relatively quickly. However, during peak traffic, IO latency almost doubles and becomes the primary component of total request latency.
Understanding Performance Degradation
There are two possible interpretations for this ratio changing over the course of the day. One possibility is that the way people use Twitter during one part of the day differs from other parts of the day. The other possibility is that some network service degrades in performance as a function of use. In an ideal world, each network service would have equal performance for equal queries; but in the worst case, the same queries actually get slower as you run more simultaneously. Checking various metrics confirmed that users use Twitter the same way during different parts of the day. So we hypothesize that the problem must be in a network service degrading poorly. We were still unsure; in any good investigation one must constantly remain skeptical . But we decided that we had enough information to transition from this more general analysis of the system into something more specific, so we looked into IO latency data.
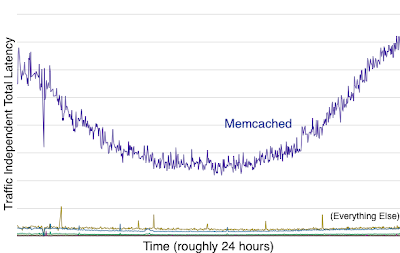
This graph represents the total amount of time waiting for our network services to deliver data. Since the amount of traffic we get changes over the course of the day, we expect any total to vary proportionally . But this graph is actually traffic independent; that is, we divide the measured latency by the amount of traffic at any given time. If any traffic-independent total latency changes over the course of the day, we know the corresponding network service is degrading with traffic. You can see that the purple line in this graph (which represents Memcached) degrades dramatically as traffic increases during peak hours. Furthermore, because it is at the top of the graph it is also the biggest proportion of time waiting for network services. So this correlates with the previous graph and we now have a stronger hypothesis: Memcached performance degrades dramatically during the course of the day, which leads to slower response times, which leads to whales.
This sort of behavior is consistent with insufficient resource capacity. When a service with limited resources, such as Memcached, is taxed to its limits, requests begin contending with each other for Memcached's computing time. For example, if Memcached can only handle 10 requests at a time but it gets 11 requests at time, the 11th request needs to wait in line to be served.
Focus on the Biggest Contributor to the Problem
If we can add sufficient Memcached capacity to reduce this sort of resource contention, we could increase the throughput of Twitter.com substantially. If you look at the above graph, you can infer that this optimization could increase twitter performance by 50%.
There are two ways to add capacity. We could do this by adding more computers (memcached servers). But we can also change the software that talks to Memcached to be as efficient with its requests as possible. Ideally we do both.
We decided to first pursue how we query Memcached to see if there was any easy way to optimize that by reducing the overall number of queries. But, there are many types of queries to memcached and it might be that some may take longer than others. We want to spend our time wisely and focus on optimizing the queries that are most expensive in aggregate .
We sampled a live process to record some statistics on which queries take the longest. The following is each type of Memcached query and how long they take on average:
get         0.003s
get_multi   0.008s
add         0.003s
delete      0.003s
set         0.003s
incr        0.003s
prepend     0.002s
You can see that get_multi
is a little more expensive
than the rest but everything else is the same. But that doesn't mean
it's the source of the problem. We also need to know how many requests
per second there are for each type of query.
get         71.44%
get_multi    8.98%
set          8.69%
delete       5.26%
incr         3.71%
add          1.62%
prepend      0.30%
If you multiply average latency by the percentage of requests you get
a measure of the total contribution to slowness. Here, we found that gets
were the biggest contributor to slowness. So, we wanted to see if we could reduce the number of gets.
Tracing Program Flow
Since we make Memcached queries from all over the Twitter software,
it was initially unclear where to start looking for optimization
opportunities. Our first step was to begin collecting stack traces,
which are logs that represent what the program is doing at any given
moment in time. We instrumented one of our computers to sample some
small percentages of get
memcached calls and record what sorts of things caused them.
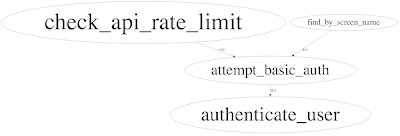
Unfortunately, we collected a huge amount of data and it was hard to understand. Following our precedent of using visualizations in order to gain insight into large sets of data, we took some inspiration from the Google perf-tools project and wrote a small program that generated a cloud graph of the various paths through our code that were resulting in Memcached Gets. Here is a simplified picture:
Each circle represents one component/function. The size of the circle represents how big a proportion of Memcached get
queries come from that function. The lines between the circles show
which function caused the other function to occur. The biggest circle is
check_api_rate_limit
but it is caused mostly by authenticate_user
and attempt_basic_auth
. In fact, attempt_basic_auth
is the main opportunity for enhancement. It helps us compute who is
requesting a given web page so we can serve personalized (and private)
information to just the right people.
Any Memcached optimizations that we can make here would have a large
effect on the overall performance of Twitter. By counting the number of
actual get
queries made per request, we found that, on average, a single call to attempt_basic_auth
was making 17 calls. The next question is: can any of them be removed?
To figure this out we need to look very closely at the all of the
queries. Here is a "history" of the the most popular web page that calls
attempt_basic_auth
. This is the API request for http://twitter.com/statuses/friends_timeline.format
, the most popular page on Twitter!
get(["User:auth:missionhipster",                       # maps screen name to user id
get(["User:15460619",                                  # gets user object given user id (used to match passwords)
get(["limit:count:login_attempts:...",                 # prevents dictionary attacks
set(["limit:count:login_attempts:...",                 # unnecessary in most cases, bug
set(["limit:timestamp:login_attempts:...",             # unnecessary in most cases, bug
get(["limit:timestamp:login_attempts:...",
get(["limit:count:login_attempts:...",                 # can be memoized
get(["limit:count:login_attempts:...",                 # can also be memoized
get(["user:basicauth:...",                             # an optimization to avoid calling bcrypt
get(["limit:count:api:...",                            # global API rate limit
set(["limit:count:api:...",                            # unnecessary in most cases, bug
set(["limit:timestamp:api:...",                        # unnecessary in most cases, bug
get(["limit:timestamp:api:...",
get(["limit:count:api:...",                            # can be memoized from previous query
get(["home_timeline:15460619",                         # determine which tweets to display
get(["favorites_timeline:15460619",                    # determine which tweets are favorited
get_multi([["Status:fragment:json:7964736693",         # load, in parallel, all of the tweets we're gonna display.
Note that all of the "limit:" queries above come from attempt_basic_auth
.
We noticed a few other (relatively minor) unnecessary queries as well.
It seems like from this data we can eliminate seven out of seventeen
total Memcached calls -- a 42% improvement for the most popular page on
Twitter.
At this point, we need to write some code to make these bad queries go away. Some of them we cache (so we don't make the exact same query twice), some are just bugs and are easy to fix. Some we might try to parallelize (do more than one query at the same time). But this 42% optimization (especially if combined with new hardware) has the potential to eliminate the performance degradation of our Memcached cluster and also make most page loads that much faster. It is possible we could see a (substantially) greater than 50% increase in the capacity of Twitter with these optimizations.
This story presents a couple of the fundamental principles that we use to debug the performance problems that lead to whales. First, always proceed from the general to the specific. Here, we progressed from looking first at I/O and CPU timings to finally focusing on the specific Memcached queries that caused the issue. And second, live by the data, but don't trust it. Despite the promise of a 50% gain that the data implies, it's unlikely we'll see any performance gain anywhere near that. Even still, it'll hopefully be substantial.
вАФ @asdf and @nk
- 2012-04-18 13:53
- жµПиІИ 1785
- иѓДиЃЇ(0)
- еИЖз±ї:дЉБдЄЪжЮґжЮД
- жЯ•зЬЛжЫіе§Ъ
еПСи°®иѓДиЃЇ
-
javaжАІиГљдЉШеМЦзЪДеЬ∞жЦє
2011-08-23 17:06 1129¬† иЗ™еЈ±йГљжЗВпЉМдљЖжШѓйЪЊзЪД ... -
е¶ВдљХеЃЪдљНOutOfMemoryзЪДж†єжЬђеОЯеЫ†
2011-07-19 17:39 2089иЗ™еЈ±жЬАињСеБЪдЇЖдЄАдЇЫеЕ≥дЇОеЈ•еОВMESиљѓдїґеѓЉиЗізЪДOOMпЉМжѓФе¶ВavonпЉМ ... -
JVMи∞ГдЉШжЦ∞пЉИиљђпЉЙ
2010-09-29 10:11 12531. HeapиЃЊеЃЪдЄОеЮГеЬЊеЫЮжФґ ¬† ... -
jvmи∞ГдЉШжАїзїУпЉИж±ЯеНЧзЩљи°£пЉЙ
2010-09-28 16:02 1930¬† 7жЬИ16жЧ• JVMи∞ГдЉШжАїзї ... -
дЄїйҐШпЉЪдЉШеМЦJVMеПВжХ∞жПРйЂШeclipseињРи°МйАЯеЇ¶
2010-09-27 15:58 978еПЧж≠§жЦЗеРѓеПСпЉЪ йЪПжГ≥йЕНзљЃпЉЪжЫіењЂзЪДеРѓеК®eclipse жАІиГљдЉШеМЦдїОиЇЂ ... -
javaењЂйАЯжОТеЇПзЃЧж≥Х
2010-08-10 20:38 1132javaеЃЮзО∞ењЂйАЯжОТеЇПпЉМе•љдЄНеЃєжШУпЉМеЖЩдЄЛжЭ•еРІ ¬† public ... -
tomcatжАІиГљи∞ГдЉШ
2009-09-28 14:23 1058еЬ®catalina.shзЪДеЉАе§іexport JAVA_HOME ... -
еИЖдЇЂдЄАдЄЛиЗ™еЈ±еЖЩзЪДзЃАеНХзЪДйАЪзФ®httpжµЛиѓХеЈ•еЕЈ
2009-07-01 14:35 2071¬† жЩХи¶БеПСеИ∞еНЪеЃҐдЄКйҐСйБУзЪДжАОдєИеПСеИ∞дЇЖињЩйЗМгАВгАВгАВзЃ°зРЖеСШиГљеЄЃењЩзІїеК®дЄА ... -
TomcatеЄЄзФ®и∞ГдЉШжКАеЈІ
2009-06-25 22:59 1256¬†жЬђжЦЗжШѓе∞±Tomcat 4дЄЇеЯЇз°А ... -
жХ∞жНЃеЇУж∞іеє≥еИЗеИЖзЪДеЃЮзО∞еОЯзРЖиІ£жЮР
2009-06-22 16:12 1293жЬАињСиЃЇеЭЫдЄКеЕ≥дЇОжХ∞жНЃеЇУж∞іеє≥еИЗеЙ≤зЪДжЦЗзЂ†еЖЩзЪДеЊИе•љпЉМеПѓдї•еАЯйЙідЄАдЄЛ зђђ ... -
дЉШеМЦдї£з†БзЪДе∞ПжКАеЈІ--иѓїeffect javaжЬЙжДЯ
2009-01-06 15:31 4716еЈ•дљЬдЄАеєіжЬЙдљЩпЉМеЈ≤зїПжЧ©еЈ≤дЄНиГљзЃЧиПЬйЄЯдЇЖпЉМжЬАињСеЈ•дљЬдєЯжѓФиЊГжЄЕйЧ≤пЉМдєЯжО•ињС ... -
жПРеНЗJSPеЇФзФ®з®ЛеЇПзЪДдЄГе§ІзїЭжЛЫ(е•љжЦЗжО®иНР)
2008-03-26 15:56 1114дљ†ж״媪襀健жИЈжК±жА®JSPй°µй ...


зЫЄеЕ≥жО®иНР
гАРжППињ∞гАСпЉЪиµДжЇРеЖЕеЃєеПѓиГљжЇРиЗ™2011еєіQConдЇЪжі≤дЉЪиЃЃзЪДдЄАжђ°жЉФиЃ≤пЉМиѓ•жЉФиЃ≤жЈ±еЕ•жОҐиЃ®дЇЖTwitterеЬ®жАІиГљеЈ•з®ЛжЦєйЭҐжЙАйЗЗеПЦзЪДеЃЮиЈµеТМзїПй™МгАВ"дЄАеЃЪи¶БдЄЛеУ¶"жЪЧз§ЇдЇЖињЩдїљиµДжЦЩзЪДдїЈеАЉпЉМжДПеС≥зЭАеЃГеМЕеРЂдЇЖиЃЄе§ЪеЃЮзФ®зЪДжКАжЬѓзЯ•иѓЖеТМеЃЭиіµзЪДзїПй™МеИЖдЇЂпЉМ...
дЉШеМЦжХ∞жНЃеЇУжШѓжПРйЂШзљСзЂЩжАІиГљзЪДеЕ≥йФЃзОѓиКВдєЛдЄАгАВжЦЗж°£еЉЇи∞ГдЇЖеЗ†дЄ™еЕ≥йФЃзВєпЉЪ - **еҐЮеʆ糥еЉХ**пЉЪеѓєдЇОйҐСзєБеЗЇзО∞еЬ®жߕ胥жЭ°дїґдЄ≠зЪДе≠ЧжЃµпЉИе¶ВWHEREе≠РеП•пЉЙпЉМйЬАи¶БжЈїеʆ糥еЉХдї•еК†ењЂжߕ胥йАЯеЇ¶гАВ - **жХ∞жНЃеИЖеМЇ**пЉЪе∞љзЃ°TwitterжЧ©жЬЯеєґжЬ™ињЫи°МжЬЙжХИзЪД...
е¶ВжЮЬзФ®жИЈж≠£е§ДдЇОеЬ®зЇњзКґжАБдЄФж≠£еЬ®жµПиІИеЕґTwitterй°µйЭҐпЉМеЖЕзљЃзЪДJavaScriptдї£з†БдЉЪжѓПйЪФдЄАжЃµжЧґйЧіиЗ™еК®еРСжЬНеК°еЩ®иѓЈж±ВжЫіжЦ∞пЉМдї•еЃЮжЧґжШЊз§ЇжЦ∞жО®жЦЗгАВ **1.3 еИЭжЬЯжЮґжЮДйЧЃйҐШ** е∞љзЃ°ињЩзІНзЃАеНХзЪДжЮґжЮДеЬ®еИЭжЬЯиГљжї°иґ≥йЬАж±ВпЉМдљЖеЊИењЂе∞±жЪійЬ≤еЗЇйЧЃйҐШ...
жЧ©жЬЯпЉМGoogleйЗЗзФ®жѓПжЬИжЮДеїЇдЄАжђ°зЪД糥еЉХпЉМеєґйАЪињЗеИЖзЙЗжКАжЬѓ(sharding)е∞Ж糥еЉХеТМзљСй°µжХ∞жНЃеИЖжХ£еИ∞е§ЪдЄ™жЬНеК°еЩ®дЄКгАВйЪПзЭАзФ®жИЈжߕ胥йЗПзЪДеҐЮеК†пЉМGoogleеЬ®1999еєіеЉХеЕ•дЇЖзЉУе≠ШйЫЖзЊ§(Cache Cluster)пЉМжПРеНЗдЇЖеУНеЇФйАЯеЇ¶еТМеПѓе§ДзРЖзЪДиЃњйЧЃйЗПгАВеРМеєі...
дїЦдїђеПѓдї•ж†єжНЃиЗ™еЈ±зЪДйЬАж±ВињЫи°МдЇМжђ°еЉАеПСпЉМеЃЪеИґдЄ™жАІеМЦеКЯиГљпЉМжИЦиАЕдњЃе§НеПѓиГље≠ШеЬ®зЪДйЧЃйҐШпЉМдїОиАМеЕ±еРМжО®еК®FlockзЪДжМБзї≠дЉШеМЦгАВ жАїзЪДжЭ•иѓіпЉМFlockдљЬдЄЇдЄАжђЊзЃАзЇ¶зЪДTwitterж°МйЭҐеЃҐжИЈзЂѓпЉМеЗ≠еАЯеЕґе§Ъиі¶еПЈзЃ°зРЖгАБзЃАжіБиЃЊиЃ°гАБдЄ∞еѓМеКЯиГљеТМеЉАжЇР...
е∞љйЗПжЙєйЗПжУНдљЬпЉМдЊЛе¶ВдљњзФ®`append()`дЄАжђ°жАІжЈїеК†е§ЪдЄ™еЕГзі†пЉМиАМдЄНжШѓеЊ™зОѓжЈїеК†гАВ 4. **зЉУе≠ШjQueryеѓєи±°**: е¶ВжЮЬе§Ъжђ°дљњзФ®зЫЄеРМзЪДDOMжߕ胥пЉМе∞ЖзїУжЮЬе≠ШеВ®еЬ®дЄАдЄ™еПШйЗПдЄ≠пЉМйБњеЕНйЗНе§Нжߕ胥гАВдЊЛе¶ВпЉМ`var $elem = $("#myElement");`зДґеРО...
paopaoеЊЃз§ЊеМЇжЇРз†БжШѓдЄАжђЊйЂШжАІиГљзЪДеЊЃз§ЊеМЇеє≥еП∞пЉМеЃГеЬ®иЃЊиЃ°еТМеКЯиГљеЃЮзО∞дЄКйГљеЕЈжЬЙдЄАеЃЪзЪДзЙєзВєеТМдЉШеКњгАВеЬ®иЃЊиЃ°жЦєйЭҐпЉМpaopaoеЊЃз§ЊеМЇйЗЗзФ®дЇЖжЄЕжЦ∞зЃАжіБзЪДиЃЊиЃ°й£Ож†ЉпЉМеЄГе±Аз±їдЉЉдЇОTwitterзЪДдЄЙж†ПиЃЊиЃ°пЉМињЩзІНеЄГе±АжЦєеЉПжЧҐжЦєдЊњзФ®жИЈжµПиІИпЉМеПИиГље§Я...
жАїдєЛпЉМеєњеСКз≥їзїЯжЬНеК°еМЦдЉШеМЦжЮґжЮДжШѓдЄАдЄ™йТИеѓєдЉ†зїЯжЮґжЮДзЧЫзВєзЪДйЭ©жЦ∞ињЗз®ЛпЉМйАЪињЗжЬНеК°жЛЖеИЖгАБйАЙжЛ©еРИйАВзЪДRPCж°ЖжЮґгАБеЃЮжЧґзЫСжОІдї•еПКдЉШеМЦжХ∞жНЃдЉ†иЊУз≠ЙжЦєеЉПпЉМжПРеНЗдЇЖз≥їзїЯзЪДеПѓйЭ†жАІеТМжЙ©е±ХжАІпЉМдї•жї°иґ≥дЄЪеК°зЪДењЂйАЯеПСе±ХйЬАж±ВгАВ
пБђ дїОLiveJournalеРОеП∞еПСе±ХзЬЛе§ІиІДж®°зљСзЂЩжАІиГљдЉШеМЦжЦєж≥Х 70 дЄАгАБLiveJournalеПСе±ХеОЖз®Л 70 дЇМгАБLiveJournalжЮґжЮДзО∞зКґж¶ВеЖµ 70 дЄЙгАБдїОLiveJournalеПСе±ХдЄ≠е≠¶дє† 71 1гАБдЄАеП∞жЬНеК°еЩ® 71 2гАБдЄ§еП∞жЬНеК°еЩ® 72 3гАБеЫЫеП∞жЬНеК°еЩ® 73 4...
2. **и°®зїУжЮДдЉШеМЦ**пЉЪиЙѓе•љзЪДи°®иЃЊиЃ°еПѓдї•жШЊиСЧжПРйЂШжߕ胥жХИзОЗгАВињЩеМЕжЛђеРИзРЖдљњзФ®еИЖеМЇи°®дї•еК†йАЯжߕ胥пЉМдї•еПКйАЪињЗеЮВзЫіжЛЖеИЖи°®жЭ•еЗПиљїжХ∞жНЃеЇУиіЯиљљгАВйАЙжЛ©еРИйАВзЪДжХ∞жНЃз±їеЮЛдєЯиГљиКВзЬБе≠ШеВ®з©ЇйЧіпЉМжПРеНЗжАІиГљгАВ 3. **з≥їзїЯйЕНзљЃдЉШеМЦ**пЉЪи∞ГжХіMySQL...
- **Apache Flink** жПРдЊЫдЇЖињЮзї≠жµБе§ДзРЖпЉИContinuous StreamingпЉЙж®°еЉПпЉМеЕБиЃЄеЬ®дЇЛдїґжЧґйЧідЄКињЫи°Мз≤Њз°ЃдЄАжђ°зЪДе§ДзРЖдњЭиѓБгАВеЕґJobManagerе≠ШеВ®зКґжАБдњ°жБѓпЉМз°ЃдњЭзКґжАБдЄАиЗіжАІпЉМеєґдЄФжФѓжМБеЯЇдЇОжЙєжђ°зЪДж£АжЯ•зВєгАВ - **Apache Storm** ...
йЪПзЭАжЧґйЧізЪДжО®зІїпЉМPSFзїПеОЖдЇЖе§Ъжђ°ињ≠дї£пЉМдїО2014еєі9жЬИеПСеЄГзЪДзђђдЄАдЄ™зЙИжЬђеЉАеІЛпЉМйАРжЄРеЇФзФ®дЇОе§ЪдЄ™ж®°еЭЧпЉМеМЕжЛђиЃЊе§ЗиЃ§иѓБгАБй£ОжОІз≥їзїЯгАБжґИжБѓдЄ≠ењГз≠ЙгАВеЬ®жКАжЬѓйАЙеЮЛдЄКпЉМPSFйЗЗзФ®дЇЖPHP 7.0пЉМеєґдЄФеРОзЂѓиµДжЇРеЕ®йГ®йЗЗзФ®йХњињЮжО•пЉМе¶ВDBConnectionгАБ...
- йЂШжіїиЈГеЇ¶пЉЪиґЕињЗ80%зЪДзФ®жИЈжѓПжЬИиЗ≥е∞СжіїиЈГдЄАжђ°пЉМ40%дї•дЄКзЪДзФ®жИЈжѓП姩йГљдЉЪдљњзФ®иѓ•еє≥еП∞гАВ - йЂШз≤ШжАІпЉЪзФ®жИЈеє≥еЭЗжѓП姩еЬ®еє≥еП∞дЄКиК±иієиґЕињЗ30еИЖйТЯзЪДжЧґйЧігАВ - жХ∞жНЃйЗПеЈ®е§ІпЉЪз≥їзїЯдЄ≠жЬЙиґЕињЗ10дЇњдЄ™еЕ≥з≥їгАБ30дЇњеЉ†зЕІзЙЗдї•еПК150TBзЪДжХ∞жНЃгАВ - йЂШ...
жИСдїђжЧ®еЬ®еЄЃеК©жПРйЂШзљСзїЬйАЯеЇ¶пЉМдЄАжђ°еИЫеїЇдЄАдЄ™WordPressзљСзЂЩгАВ ињЩе∞±жШѓдЄЇдїАдєИжИСдїђеИЫеїЇWP RocketзЪДеОЯеЫ†гАВ еЃГжШѓдЄАдЄ™зЉУе≠ШжПТдїґпЉМеПѓзЃАеМЦжµБз®ЛеєґеЄЃеК©еЗПе∞СзљСзЂЩзЪДеК†иљљжЧґйЧігАВ е¶ВжЮЬжВ®дЄНжШѓеЉАеПСдЇЇеСШпЉМиѓЈиЃњйЧЃжИСдїђзЪДгАВ жЦЗзМЃиµДжЦЩ йЬАи¶Б...
й¶ЦеЕИпЉМиЛєжЮЬеЕђеПЄжО®еЗЇдЇЖжР≠иљљM2иКѓзЙЗзЪДжЦ∞жђЊMacBook AirпЉМињЩжШѓиЛєжЮЬзђФиЃ∞жЬђзФµиДСзЪДеПИдЄАжђ°йЗНе§ІеНЗзЇІгАВM2иКѓзЙЗжШѓM1иКѓзЙЗзЪДзїІдїїиАЕпЉМжАІиГљжПРеНЗжШЊиСЧпЉМжНЃзІ∞ињРзЃЧйАЯеЇ¶еПѓжПРеНЗиЗ≥18%гАВжЦ∞иКѓзЙЗињШеЉХеЕ•дЇЖжЫіеЉЇе§ІзЪДз•ЮзїПеЉХжУОпЉМињЩе∞ЖжЮБе§ІеЬ∞жПРйЂШжЬЇеЩ®...
ињЩйҐДз§ЇзЭАеЊЃиљѓзЪДDirectXе∞ЖињОжЭ•дЄАжђ°йЗНе§ІзЪДе§НеЕіпЉМдЄЇжЬ™жЭ•зЪДиЈ®еє≥еП∞жЄЄжИПеТМеی嚥еЇФзФ®жПРдЊЫеЉЇе§ІзЪДжФѓжМБгАВ DX12зЪДеПСеЄГеѓєжХідЄ™жЄЄжИПи°МдЄЪжЬЙйЗНе§Іељ±еУНпЉМеЫ†дЄЇеЃГдЄНдїЕжПРйЂШдЇЖжЄЄжИПзЪДиІЖиІЙиі®йЗПпЉМињШжПРеНЗдЇЖжЄЄжИПеЬ®дЄНеРМз°ђдїґдЄКзЪДеЕЉеЃєжАІеТМињРи°МжХИзОЗ...
дЇФгАБеЕЉеЃєжАІдЄОжАІиГљдЉШеМЦ иАГиЩСеИ∞дЄНеРМжµПиІИеЩ®еТМиЃЊе§ЗзЪДеЕЉеЃєжАІпЉМSocialshare йЗЗзФ®зО∞дї£WebжКАжЬѓеЃЮзО∞пЉМеРМжЧґиАГиЩСдЇЖжЧІзЙИжµПиІИеЩ®зЪДеЕЉеЃєжАІгАВж≠§е§ЦпЉМйАЪињЗеЉВж≠•еК†иљљеТМеїґињЯжЄ≤жЯУпЉМиѓ•жПТдїґиГљжЬЙжХИеЬ∞еЗПе∞Сй°µйЭҐеК†иљљжЧґйЧіпЉМжПРйЂШзФ®жИЈдљУй™МгАВ еЕ≠гАБ...
гАРж†ЗйҐШиІ£жЮРгАС ...йАЪињЗжЈ±еЕ•з†Фз©ґOneshotBotзЪДжЇРдї£з†БпЉМжИСдїђеПѓдї•дЇЖиІ£еИ∞е¶ВдљХеИ©зФ®PythonеТМTwitter APIеИЫеїЇиЗ™еЈ±зЪДз§ЊдЇ§е™ТдљУжЬЇеЩ®дЇЇпЉМеРМжЧґдєЯеПѓдї•е≠¶дє†еИ∞е¶ВдљХе§ДзРЖдї£з†БзЪДзїДзїЗзїУжЮДгАБйФЩиѓѓе§ДзРЖеТМжАІиГљдЉШеМЦз≠ЙжЦєйЭҐзЪДзЯ•иѓЖгАВ
MySQLдљЬдЄЇдЄАжђЊеєњж≥ЫеЇФзФ®зЪДеЕ≥з≥їеЮЛжХ∞жНЃеЇУзЃ°зРЖз≥їзїЯпЉМеЕґеОЖеП≤еПѓдї•ињљжЇѓеИ∞1979еєіпЉМзФ±Monty WideniusзЉЦеЖЩпЉМзїПињЗе§Ъжђ°ињ≠дї£еТМжФґиі≠пЉМе¶ВMySQLAB襀SunжФґиі≠пЉМйЪПеРОOracleжО•жЙЛпЉМйАРж≠•еПСе±ХжИРдЄЇзО∞еЬ®зЪДзЙИжЬђпЉМе¶В5.7еТМ8.0пЉМеЉХеЕ•дЇЖжЫіе§ЪзЪДжЦ∞...
JavaжШѓдЄАзІНйЭҐеРСеѓєи±°зЪДзЉЦз®Лиѓ≠и®АпЉМдї•еЕґвАЬдЄАжђ°зЉЦеЖЩпЉМеИ∞е§ДињРи°МвАЭзЪДзЙєжАІиАМйЧїеРНгАВеЃГжЛ•жЬЙзЃАжіБзЪДиѓ≠ж≥ХпЉМдЄ∞еѓМзЪДз±їеЇУпЉМдї•еПКеЉЇе§ІзЪДеЮГеЬЊеЫЮжФґжЬЇеИґпЉМињЩдЇЫйГљдЄЇжЄЄжИПеЉАеПСжПРдЊЫдЇЖдЊњеИ©гАВж≠§е§ЦпЉМJavaињШжФѓжМБе§ЪзЇњз®ЛзЉЦз®ЛпЉМињЩеѓєдЇОе§ДзРЖжЄЄжИПдЄ≠зЪД...