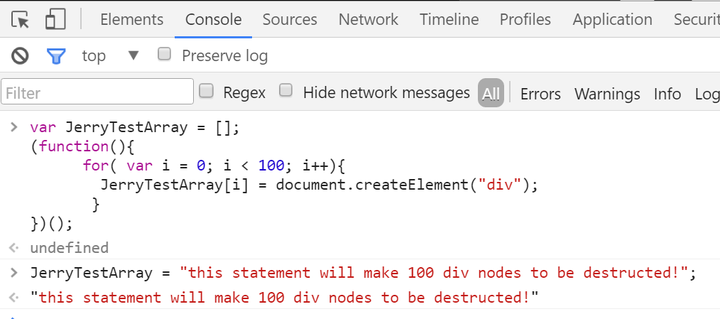
I use the following simple JavaScript code to illustrate:
var JerryTestArray = [];
(function(){
      for( var i = 0; i < 100; i++){
        JerryTestArray[i] = document.createElement("div");
       }
})();
Create a new empty tab in your Chrome, and first create a snapshot with empty heap status by click “Take Snapshot” button:

The Snapshot1 is generated.

Now switch to tab Console, paste the JavaScript code and execute it in console.

And switch to Profiles tab again to make the second snapshot:

Once done, select the second snapshot, choose “Comparison” and “Snapshot1” as filter:

We can find out from column “New” that 100 div nodes are created as we expect.

Since these nodes are not appended to document node so they are invisible to end user, so displayed as “Detached DOM”. The JerryTestArray still holds the reference to each div node so Garbage collector will not touch these nodes.
In order to make Garbage collector recycle the memory occupied by these nodes, just assign another value to JerryTestArray in console:

Once done, make the third snapshot and compare it with the second. Now we can find that the re-assignment to JerryTestArray will trigger the destruction of those 100 div nodes by Garbage collector:

Meanwhile, the string we use in assignment could also be inspected via the combination of filters below:

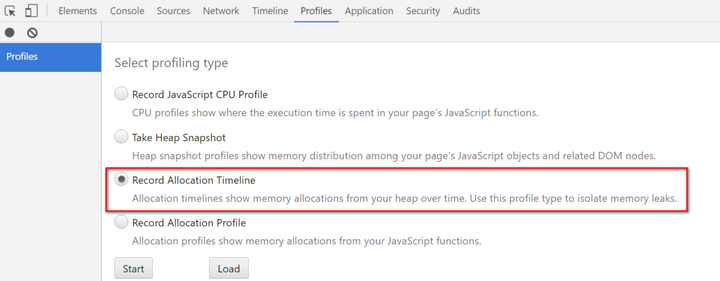
There is another kind of profile in Chrome development tool which can give you an overview about timeline of memory allocation:

Click Start button in above screenshot, and paste the following code in console and executed:
var JerryTestArray = [];
(function(){
      for( var i = 0; i < 98; i++){
        JerryTestArray[i] = document.createElement("span");
        JerryTestArray[i].className = "JerryClassName" + i;
       }
})();
After the code is executed, paste the following code and execute:
JerryTestArray[30] = "this is a long test............................end";
Now stop the profile. The profile is displayed as below. The highlighted vertical blue line indicates the timeslot when the 97 Span elements are created. Note that the number of Span elements displayed here is not 98 but 97 since Chrome development tool displays the final status of objects after “stop profile” button is clicked ( the reference to 30th Span element is replaced by String, so it is recycled by GC ).

You can drag the two vertical bars to define the time range between which you would like to inspect. For example the time range below contains the timeslot when the below assignment occurs:
JerryTestArray[30] = "this is a long test............................end";

With this gained knowledge now we can check the memory allocation and destruction in some real application. For example click tile “My Tasks” to enter this application, make the first snapshot and click back button within application to return to launchpad, and make the second snapshot and review the comparison result.

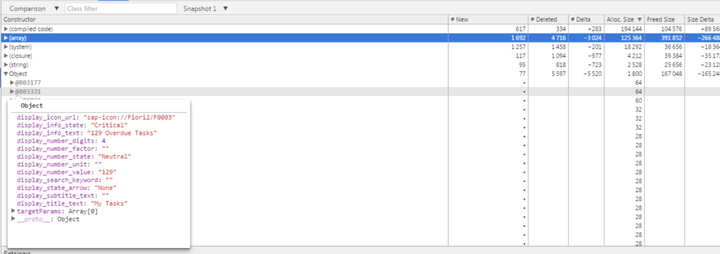
From the result we find out lots of stuff are deleted after we return to launchpad:

Hover your mouse to a given destructed object and you can review its detail:

For more tips How I use Chrome development tool in my daily work, please refer to this blog Chrome Development Tool tips used in my daily work
要获取更多Jerry的原创文章,请关注公众号"汪子熙":


相关推荐
V8的源码结构清晰,分为多个组件,如字节码解释器(Ignition),编译器(TurboFan和Lithium),垃圾回收器(Scavenger和Mark-Compact Collector),以及内存分配系统等。通过阅读和研究这些源码,开发者可以学习到...
对于不再使用的变量或对象,可以显式地设置为`null`,使其尽早被垃圾回收机制(garbage collector)清理。 此外,JavaScript引擎的优化机制,如即时编译(JIT)和惰性求值(lazy evaluation),会在一定程度上提高...
在JavaScript中,内存是由垃圾收集器(Garbage Collector, GC)自动管理的。当一个对象不再被引用时,GC会回收其占用的内存空间。然而,由于JavaScript的动态特性,一些情况下,即使对象不再使用,它们仍然无法被GC...
2. **V8架构**:V8由多个关键组件组成,包括解释器(Ignition)、编译器(TurboFan)、垃圾收集器(Garbage Collector)和内存分配系统等。Ignition处理低级别的解释,TurboFan负责高级别的优化编译,而垃圾收集器则...
JavaScript是一种动态类型语言,它的内存管理由垃圾收集器(Garbage Collector, GC)自动进行。当一个对象不再被引用时,GC会将其回收,释放内存。然而,由于JavaScript的运行环境(如浏览器)的复杂性,内存泄漏的...
4. **垃圾回收器(Garbage Collector)**:自动管理内存,确保不再使用的对象被释放,防止内存泄漏。 5. **调用堆栈**:用于存储函数调用的信息,确保代码的正确执行顺序。 6. **执行上下文(Execution Context)*...