
InstallXDebug
1. Go tohttp://www.xdebug.org/;downloadXdebug(version 2.0.3 at the time of this writing).
2. Putphp_xdebug-2.0.3-5.2.5.dllyou just downloaded to some folder; Add the following line tophp.inifile so that PHP can load it:
zend_extension_ts="D:/ProgramFiles/PHP5.2/modules/php_xdebug-2.0.3-5.2.5.dll"
xdebug.remote_enable=On
xdebug.remote_host="127.0.0.1"
xdebug.remote_port=9000
xdebug.remote_handler="dbgp"
xdebug.remote_log="d:/xdebug.log"
Ensure you place your entries at the bottom of your php.ini file or XDebug could fail to load.
You may need to change the “zend_extension_ts” to “zend_extension” if you are using the non thread safe version of PHP or to “zend_extension_debug” if you are using the debug version. This information can be found by running phpinfo() and locate the following section:
Debug Build => no
Thread Safety => enabled
3. TestingXDebug is installed correctly byCallphpinfo()function in a page, or run this:
php -m
You should be able to see a section for XDebug if successfully installed.
Configure PDT to Use XDebug
1. Configure PHP Executables in
Windows > Preference > PHP > Debug.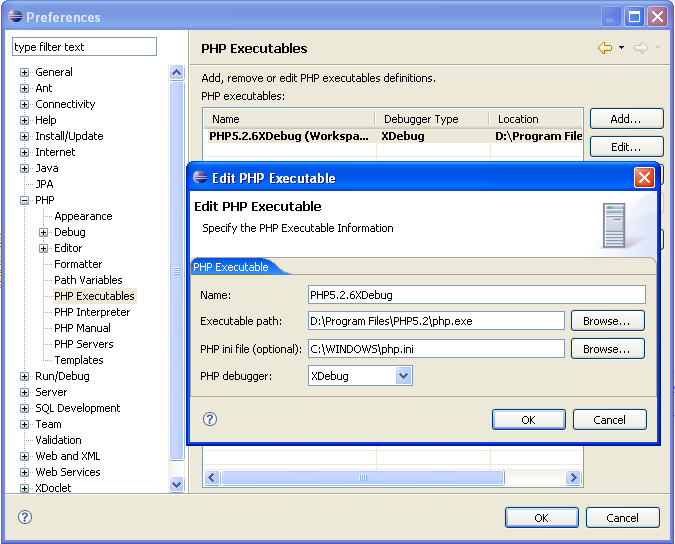
2. Configure PHP Server for debugging Web Pages. (You can refer to the "Add Virtual Host" of the part 1, which configures the current project tobe a Virtual Host.)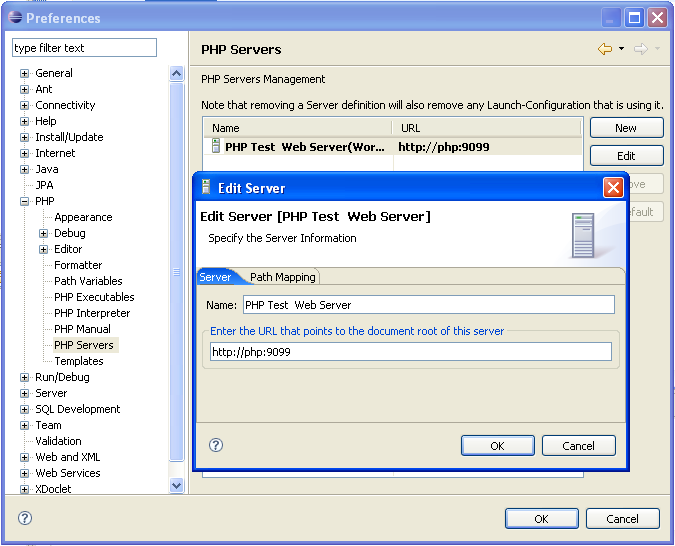
3. Configure the default debug settings to use XDebug.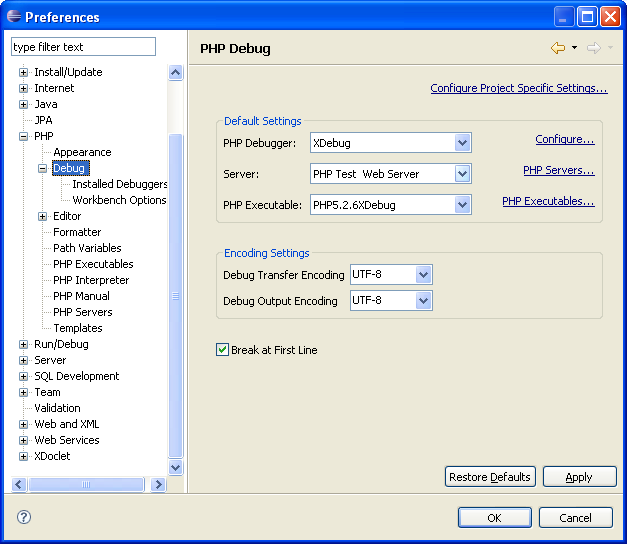
4. Next we configure the debug settings for the current project. First go to
Run > Open Debug Dialog...
5. Next we create a newPHP Scriptconfiguration.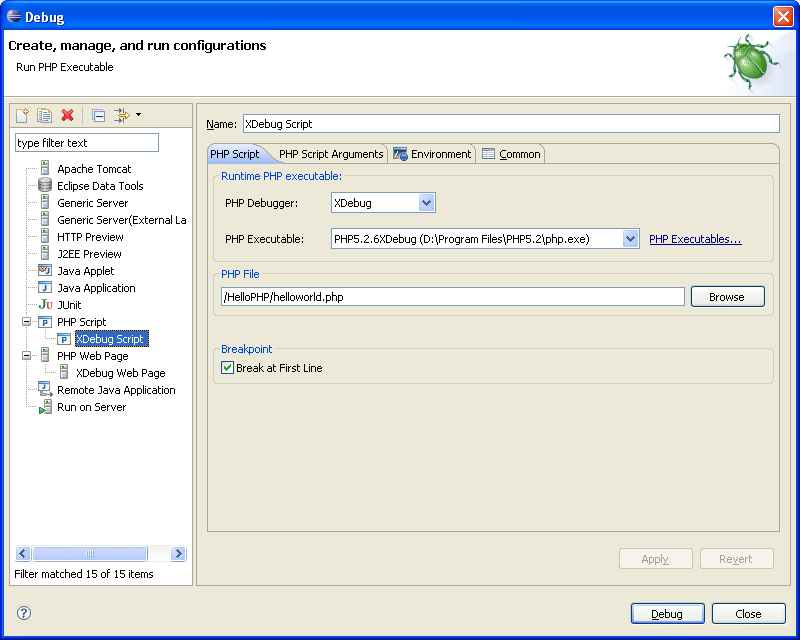
6. Then we create a configuration for debuggingPHP Web Page.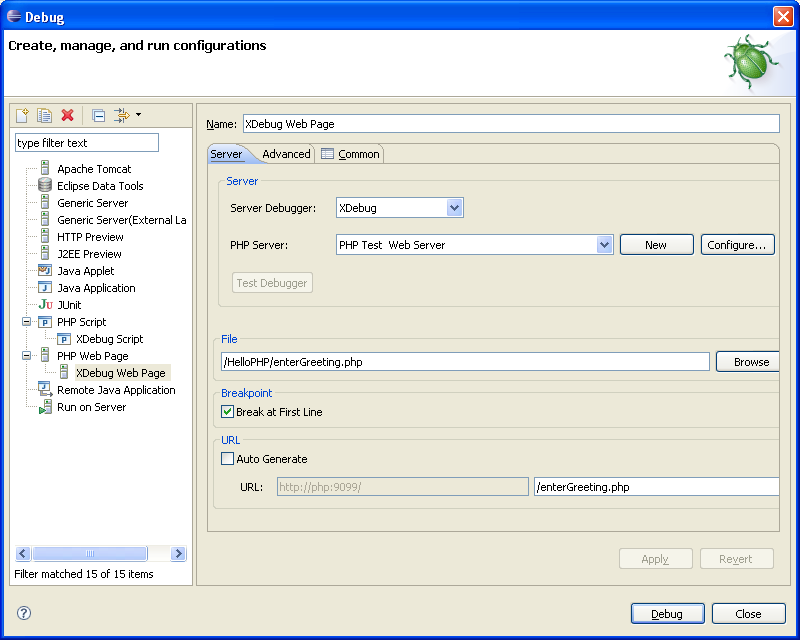
7. Now create some test php script/pages, click on the "Debug" button to start debugging.
Reference
XDebug Guide
http://www.eclipse.org/pdt/documents/XDebugGuide.pdf
How To Setup a Free PHP Debugger using Eclipse PDT + XDebug
http://robsnotebook.com/php_debugger_pdt_xdebug
Debugging PHP applications with xdebug
http://devzone.zend.com/article/2930-Debugging-PHP-applications-with-xdebug
Debugging PHP using Eclipse PDT + Zend Debugger / Xdebug
http://www.ibm.com/developerworks/edu/os-dw-os-php-eclipse-pdt-debug.html
Debugging PHP Applications with Xdebug and Eclipse PDT
http://www.64bitjungle.com/tech/debugging-php-applications-with-xdebug-and-eclipse-pdt/
Squash bugs in PHP applications with Xdebug
http://www.ibm.com/developerworks/opensource/library/os-php-xdebug/?S_TACT=105AGX44&S_CMP=TUT


相关推荐
使用 Eclipse 和 PDT 可以实现在 IDE 内进行单步调试,让开发人员更方便地发现和修复错误。 本文将介绍如何使用 Eclipse 和 PDT 调试 PHP,包括设置调试环境、安装 PDT 插件、配置调试器、创建项目、添加调试点、...
### PDT与Xdebug搭建PHP...通过这种方式,你可以利用Eclipse PDT和Xdebug有效地进行PHP代码的调试,提高开发效率。 以上就是使用PDT与Xdebug搭建PHP开发调试环境的具体步骤,希望能够帮助到正在学习PHP开发的朋友。
【Eclipse 和 PDT 调试 PHP 知识点详解】 Eclipse 是一款广泛使用的集成开发环境(IDE),尤其在Java开发中应用广泛。然而,通过安装PHP Development Tools(PDT)插件,Eclipse 也能成为强大的PHP开发平台。PDT ...
标题 "比较好的开发组合工具 eclipse+pdt+aptana+xdebug+firebug" 涉及的是一个集成开发环境(IDE)的配置方案,这个组合在IT行业中被广泛用于PHP开发。下面将详细介绍这些组件及其作用。 1. **Eclipse**: ...
如果你选择离线安装,可以从Eclipse的发布站点下载包含PDT的Eclipse版本。 为了进行PHP的调试,我们需要一个调试器。这里我们选用Xdebug,它是广泛使用的PHP调试工具。你可以从Xdebug的官方网站下载源代码包。解压...
本文将详细介绍如何安装Eclipse及PDT,配置调试器xdebug,以及如何在Eclipse PDT中进行断点调试。 首先,**安装Eclipse和PDT**: 1. 下载Eclipse IDE,确保系统中已安装Java环境,包括JDK和JRE。访问Eclipse官方...
在提供的压缩包文件中,Eclipse PDT.1.0.3.exe很可能是Eclipse PDT Installer的一个特定版本的安装程序。用户可以通过运行这个可执行文件来安装Eclipse PDT框架及其相关插件到他们的Eclipse环境中。在安装过程中,...
1. **安装 PDT 插件**:eclipsePHP需要PDT(PHP Development Tools)插件来支持Xdebug。通过eclipse的“Help” > “Eclipse Marketplace”搜索并安装PDT。 2. **启用Xdebug**:与phpStorm类似,你需要在php.ini中...
PDT开发php XDebug调试手册 在eclipse for php中配置xdebug 以及调试技术详细手册
3. **集成Eclipse**:描述中提到XDebug与Eclipse的配合使用,Eclipse是一款流行的开源IDE,具有强大的PHP开发插件如PDT。在Eclipse中,你需要安装XDebug透视图(如PHP Debug)并配置相应的调试设置,包括IDE Key、...
这里`path_to_xdebug_dll`应替换为实际的Xdebug dll文件路径,`localhost`通常表示调试服务器自身,`9000`是默认的调试端口,`ECLIPSE_DBGP`是IDEKey,用于识别Eclipse调试会话。 3. **重启PHP服务**: 修改配置后...
This extension is very useful for PHP developers that are using PHP tools with Xdebug support like PHPStorm, Eclipse with PDT, Netbeans and MacGDBp or any other Xdebug compatible profiling tool like ...
本文将详细阐述如何通过Eclipse IDE、PHP Development Tools (PDT)插件与Xdebug插件的深度集成,构建一个具备自动化代码嗅探、代码提示及断点调试功能的专业级PHP开发环境。 #### 步骤一:环境搭建与软件准备 **1....
为了充分利用Xdebug的功能,通常需要将其与集成开发环境(IDE)如PHPStorm、Eclipse PDT或Visual Studio Code等进行集成。这样,IDE可以提供图形化的断点管理、变量查看以及代码步进等调试功能,让调试过程更为直观...
3. **兼容性广泛**:Xdebug Helper不仅支持PHPStorm,还兼容其他基于Xdebug的调试工具,如Eclipse PDT、NetBeans等。 4. **实时反馈**:当Xdebug成功启动时,插件会显示当前的调试状态,便于开发者了解调试是否已...
1. IDE集成:将Xdebug与PHP IDE(如PHPStorm、Eclipse PDT)集成,设置断点,通过HTTP请求触发调试会话。 2. 远程调试:通过xdebug.remote_host和xdebug.remote_port配置,使Xdebug连接到开发者的本地IDE,实现远程...
- 在Eclipse中安装相应的调试插件,如PDT自带的Xdebug支持。 - 配置Xdebug与Eclipse之间的连接参数。 3. **集成版本控制系统:** - 对于团队协作开发,可以配置Eclipse与Git等版本控制系统的集成。 - 在Eclipse...
Xdebug可以与许多集成开发环境(IDE)无缝集成,如PHPStorm、Eclipse PDT等,提供断点调试、步进执行、变量查看等功能,大大提高开发效率。 总之,Xdebug 5.6是PHP开发者不可或缺的工具,它提供的调试和性能分析...
此扩展对于PHP开发人员非常有用,PHP开发人员使用带有Xdebug支持的PHP工具,如PHPStorm,Eclipse with PDT,Netbeans和MacGDBp或任何其他Xdebug兼容性分析工具,如KCacheGrind,WinCacheGrind或Webgrind。