
(From: http://www.oracle.com/technetwork/java/javase/gc-tuning-6-140523.html)
Java SE 6 HotSpot[tm] Virtual Machine Garbage Collection Tuning
<!-- content goes here -->|
|
Table of Contents
1. Introduction
The Java™ Platform, Standard Edition (Java SE™) is used for a wide variety of applications, from small applets on desktops to web services on large servers. In support of this diverse range of deployments, the Java HotSpot™ virtual machine implementation (Java HotSpot™ VM) provides multiple garbage collectors, each designed to satisfy different requirements. This is an important part of meeting the demands of both large and small applications. However, users, developers and administrators that need high performance are burdened with the extra step of selecting the garbage collector that best meets their needs. A significant step toward removing this burden was made in J2SE™ 5.0: the garbage collector is selected based on the class of the machine on which the application is run.
This better choice of the garbage collector is generally an improvement, but is by no means always the best choice for every application. Users with strict performance goals or other requirements may need to explicitly select the garbage collector and tune certain parameters to achieve the desired level of performance. This document provides information to help with those tasks. First, the general features of a garbage collector and basic tuning options are described in the context of the serial, stop-the-world collector. Then specific features of the other collectors are presented along with factors to consider when selecting a collector.
When does the choice of a garbage collector matter? For some applications, the answer is never. That is, the application can perform well in the presence of garbage collection with pauses of modest frequency and duration. However, this is not the case for a large class of applications, particularly those with large amounts of data (multiple gigabytes), many threads and high transaction rates.
Amdahl observed that most workloads cannot be perfectly parallelized; some portion is always sequential and does not benefit from parallelism. This is also true for the Java™ platform. In particular, virtual machines from Sun Microsystems for the Java platform prior to J2SE 1.4 do not support parallel garbage collection, so the impact of garbage collection on a multiprocessor system grows relative to an otherwise parallel application.
The graph below models an ideal system that is perfectly scalable with the exception of garbage collection. The red line is an application spending only 1% of the time in garbage collection on a uniprocessor system. This translates to more than a 20% loss in throughput on 32 processor systems. At 10% of the time in garbage collection (not considered an outrageous amount of time in garbage collection in uniprocessor applications) more than 75% of throughput is lost when scaling up to 32 processors.

This shows that negligible speed issues when developing on small systems may become principal bottlenecks when scaling up to large systems. However, small improvements in reducing such a bottleneck can produce large gains in performance. For a sufficiently large system it becomes well worthwhile to select the right garbage collector and to tune it if necessary.
The serial collector is usually adequate for most "small" applications (those requiring heaps of up to approximately 100MB on modern processors). The other collectors have additional overhead and/or complexity which is the price for specialized behavior. If the application doesn't need the specialized behavior of an alternate collector, use the serial collector. An example of a situation where the serial collector is not expected to be the best choice is a large application that is heavily threaded and run on a machine with a large amount of memory and two or more processors. When applications are run on such server-class machines, the parallel collector is selected by default (see Ergonomics below).
This document was developed using Java SE 6 on the Solaris™ Operating System (SPARC (R) Platform Edition) as the reference. However, the concepts and recommendations presented here apply to all supported platforms, including Linux, Microsoft Windows and the Solaris Operating System (x86 Platform Edition). In addition, the command line options mentioned are available on all supported platforms, although the default values of some options may be different on each platform.
2. Ergonomics
A feature referred to here as ergonomics was introduced in J2SE 5.0. The goal of ergonomics is to provide good performance with little or no tuning of command line options by selecting the
- garbage collector,
- heap size,
- and runtime compiler
at JVM startup, instead of using fixed defaults. This selection assumes that the class of the machine on which the application is run is a hint as to the characteristics of the application (i.e., large applications run on large machines). In addition to these selections is a simplified way of tuning garbage collection. With the parallel collector the user can specify goals for a maximum pause time and a desired throughput for an application. This is in contrast to specifying the size of the heap that is needed for good performance. This is intended to particularly improve the performance of large applications that use large heaps. The more general ergonomics is described in the document entitled “Ergonomics in the 5.0 Java Virtual Machine”. It is recommended that the ergonomics as presented in this latter document be tried before using the more detailed controls explained in this document.
Included in this document are the ergonomics features provided as part of the adaptive size policy for the parallel collector. This includes the options to specify goals for the performance of garbage collection and additional options to fine tune that performance.
3. Generations
One strength of the J2SE platform is that it shields the developer from the complexity of memory allocation and garbage collection. However, once garbage collection is the principal bottleneck, it is worth understanding some aspects of this hidden implementation. Garbage collectors make assumptions about the way applications use objects, and these are reflected in tunable parameters that can be adjusted for improved performance without sacrificing the power of the abstraction.
An object is considered garbage when it can no longer be reached from any pointer in the running program. The most straightforward garbage collection algorithms simply iterate over every reachable object. Any objects left over are then considered garbage. The time this approach takes is proportional to the number of live objects, which is prohibitive for large applications maintaining lots of live data.
Beginning with the J2SE 1.2, the virtual machine incorporated a number of different garbage collection algorithms that are combined using generational collection. While naive garbage collection examines every live object in the heap, generational collection exploits several empirically observed properties of most applications to minimize the work required to reclaim unused ("garbage") objects. The most important of these observed properties is the weak generational hypothesis, which states that most objects survive for only a short period of time.
The blue area in the diagram below is a typical distribution for the lifetimes of objects. The X axis is object lifetimes measured in bytes allocated. The byte count on the Y axis is the total bytes in objects with the corresponding lifetime. The sharp peak at the left represents objects that can be reclaimed (i.e., have "died") shortly after being allocated. Iterator objects, for example, are often alive for the duration of a single loop.
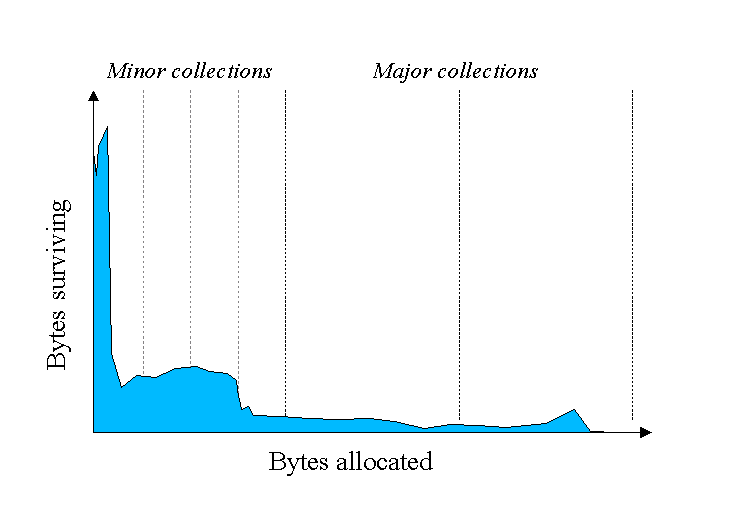
Some objects do live longer, and so the distribution stretches out to the the right. For instance, there are typically some objects allocated at initialization that live until the process exits. Between these two extremes are objects that live for the duration of some intermediate computation, seen here as the lump to the right of the initial peak. Some applications have very different looking distributions, but a surprisingly large number possess this general shape. Efficient collection is made possible by focusing on the fact that a majority of objects "die young."
To optimize for this scenario, memory is managed in generations, or memory pools holding objects of different ages. Garbage collection occurs in each generation when the generation fills up. The vast majority of objects are allocated in a pool dedicated to young objects (the young generation), and most objects die there. When the young generation fills up it causes a minor collection in which only the young generation is collected; garbage in other generations is not reclaimed. Minor collections can be optimized assuming the weak generational hypothesis holds and most objects in the young generation are garbage and can be reclaimed. The costs of such collections are, to the first order, proportional to the number of live objects being collected; a young generation full of dead objects is collected very quickly. Typically some fraction of the surviving objects from the young generation are moved to the tenured generation during each minor collection. Eventually, the tenured generation will fill up and must be collected, resulting in a major collection, in which the entire heap is collected. Major collections usually last much longer than minor collections because a significantly larger number of objects are involved.
As noted above, ergonomics selects the garbage collector dynamically in order to provide good performance on a variety of applications. The serial garbage collector is designed for applications with small data sets and its default parameters were chosen to be effective for most small applications. The throughput garbage collector is meant to be used with applications that have medium to large data sets. The heap size parameters selected by ergonomics plus the features of the adaptive size policy are meant to provide good performance for server applications. These choices work well in most, but not all, cases. Which leads to the central tenet of this document:
| If garbage collection becomes a bottleneck, you will most likely have to customize the total heap size as well as the sizes of the individual generations. Check the verbose garbage collector output and then explore the sensitivity of your individual performance metric to the garbage collector parameters. |
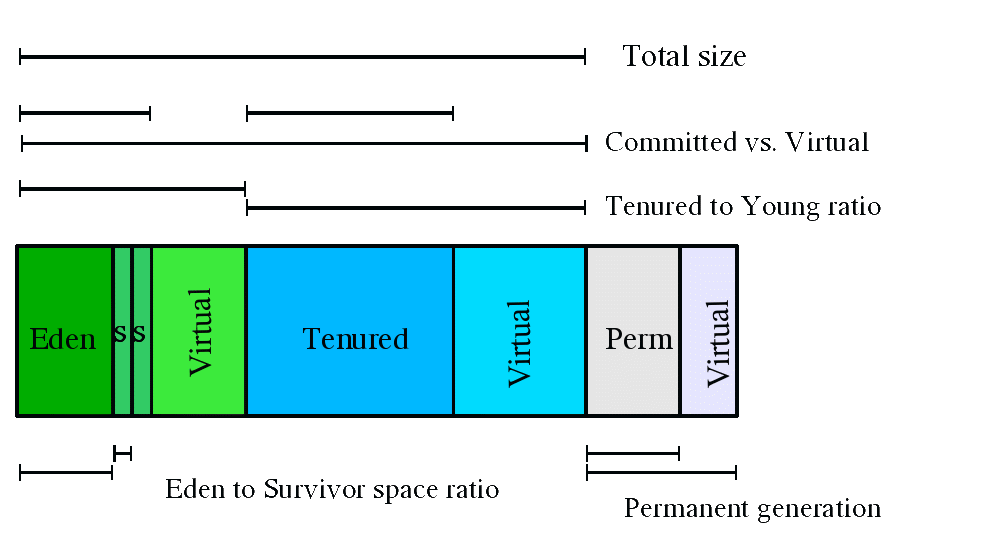
The default arrangement of generations (for all collectors with the exception of the parallel collector) looks something like this.

At initialization, a maximum address space is virtually reserved but not allocated to physical memory unless it is needed. The complete address space reserved for object memory can be divided into the young and tenured generations.
The young generation consists of eden and two survivor spaces. Most objects are initially allocated in eden. One survivor space is empty at any time, and serves as the destination of any live objects in eden and the other survivor space during the next copying collection. Objects are copied between survivor spaces in this way until they are old enough to be tenured (copied to the tenured generation).
A third generation closely related to the tenured generation is the permanent generation which holds data needed by the virtual machine to describe objects that do not have an equivalence at the Java language level. For example objects describing classes and methods are stored in the permanent generation.
Performance Considerations
There are two primary measures of garbage collection performance:
- Throughput is the percentage of total time not spent in garbage collection, considered over long periods of time. Throughput includes time spent in allocation (but tuning for speed of allocation is generally not needed).
- Pauses are the times when an application appears unresponsive because garbage collection is occurring.
Users have different requirements of garbage collection. For example, some consider the right metric for a web server to be throughput, since pauses during garbage collection may be tolerable, or simply obscured by network latencies. However, in an interactive graphics program even short pauses may negatively affect the user experience.
Some users are sensitive to other considerations. Footprint is the working set of a process, measured in pages and cache lines. On systems with limited physical memory or many processes, footprint may dictate scalability. Promptness is the time between when an object becomes dead and when the memory becomes available, an important consideration for distributed systems, including remote method invocation (RMI).
In general, a particular generation sizing chooses a trade-off between these considerations. For example, a very large young generation may maximize throughput, but does so at the expense of footprint, promptness and pause times. young generation pauses can be minimized by using a small young generation at the expense of throughput. To a first approximation, the sizing of one generation does not affect the collection frequency and pause times for another generation.
There is no one right way to size generations. The best choice is determined by the way the application uses memory as well as user requirements. Thus the virtual machine's choice of a garbage collectior is not always optimal and may be overridden with command line options described below.
Measurement
Throughput and footprint are best measured using metrics particular to the application. For example, throughput of a web server may be tested using a client load generator, while footprint of the server might be measured on the Solaris Operating System using the pmap command. On the other hand, pauses due to garbage collection are easily estimated by inspecting the diagnostic output of the virtual machine itself.
The command line option -verbose:gc causes information about the heap and garbage collection to be printed at each collection. For example, here is output from a large server application:
[GC 325407K->83000K(776768K), 0.2300771 secs]
[GC 325816K->83372K(776768K), 0.2454258 secs]
[Full GC 267628K->83769K(776768K), 1.8479984 secs]
Here we see two minor collections followed by one major collection. The numbers before and after the arrow (e.g., 325407K->83000K from the first line) indicate the combined size of live objects before and after garbage collection, respectively. After minor collections the size includes some objects that are garbage (no longer alive) but that cannot be reclaimed. These objects are either contained in the tenured generation, or referenced from the tenured or permanent generations.
The next number in parentheses (e.g., (776768K) again from the first line) is the committed size of the heap: the amount of space usable for java objects without requesting more memory from the operating system. Note that this number does not include one of the survivor spaces, since only one can be used at any given time, and also does not include the permanent generation, which holds metadata used by the virtual machine.
The last item on the line (e.g., 0.2300771 secs) indicates the time taken to perform the collection; in this case approximately a quarter of a second.
The format for the major collection in the third line is similar.
The format of the output produced by -verbose:gc is subject to change in future releases. |
The option -XX:+PrintGCDetails causes additional information about the collections to be printed. An example of the output with -XX:+PrintGCDetails using the serial garbage collector is shown here.
[GC [DefNew: 64575K->959K(64576K), 0.0457646 secs] 196016K->133633K(261184K), 0.0459067 secs]
indicates that the minor collection recovered about 98% of the young generation, DefNew: 64575K->959K(64576K) and took 0.0457646 secs (about 45 milliseconds).
The usage of the entire heap was reduced to about 51% 196016K->133633K(261184K) and that there was some slight additional overhead for the collection (over and above the collection of the young generation) as indicated by the final time of 0.0459067 secs.
The option -XX:+PrintGCTimeStamps will add a time stamp at the start of each collection. This is useful to see how frequently garbage collections occur.
111.042: [GC 111.042: [DefNew: 8128K->8128K(8128K), 0.0000505 secs]111.042: [Tenured: 18154K->2311K(24576K), 0.1290354 secs] 26282K->2311K(32704K), 0.1293306 secs]
The collection starts about 111 seconds into the execution of the application. The minor collection starts at about the same time. Additionally the information is shown for a major collection delineated by Tenured. The tenured generation usage was reduced to about 10% 18154K->2311K(24576K) and took 0.1290354 secs (approximately 130 milliseconds).
As was the case with -verbose:gc, the format of the output produced by -XX:+PrintGCDetails is subject to change in future releases. |
4. Sizing the Generations
A number of parameters affect generation size. The following diagram illustrates the difference between committed space and virtual space in the heap. At initialization of the virtual machine, the entire space for the heap is reserved. The size of the space reserved can be specified with the -Xmx option. If the value of the -Xms parameter is smaller than the value of the -Xmx parameter, not all of the space that is reserved is immediately committed to the virtual machine. The uncommitted space is labeled "virtual" in this figure. The different parts of the heap (permanent generation, tenured generation and young generation) can grow to the limit of the virtual space as needed.
Some of the parameters are ratios of one part of the heap to another. For example the parameter NewRatio denotes the relative size of the tenured generation to the young generation. These parameters are discussed below.
Total Heap
Note that the following discussion regarding growing and shrinking of the heap and default heap sizes does not apply to the parallel collector. (See the section on ergonomics for details on heap resizing and default heap sizes with the parallel collector.) However, the parameters that control the total size of the heap and the sizes of the generations do apply to the parallel collector.
Since collections occur when generations fill up, throughput is inversely proportional to the amount of memory available. Total available memory is the most important factor affecting garbage collection performance.
By default, the virtual machine grows or shrinks the heap at each collection to try to keep the proportion of free space to live objects at each collection within a specific range. This target range is set as a percentage by the parameters -XX:MinHeapFreeRatio=<minimum> and -XX:MaxHeapFreeRatio=<maximum>, and the total size is bounded below by -Xms<min> and above by -Xmx<max>. The default parameters for the 32-bit Solaris Operating System (SPARC Platform Edition) are shown in this table:
MinHeapFreeRatio |
40 |
MaxHeapFreeRatio |
70 |
-Xms |
3670k |
-Xmx |
64m |
Default values of heap size parameters on 64-bit systems have been scaled up by approximately 30%. This increase is meant to compensate for the larger size of objects on a 64-bit system.
With these parameters, if the percent of free space in a generation falls below 40%, the generation will be expanded to maintain 40% free space, up to the maximum allowed size of the generation. Similarly, if the free space exceeds 70%, the generation will be contracted so that only 70% of the space is free, subject to the minimum size of the generation.
Large server applications often experience two problems with these defaults. One is slow startup, because the initial heap is small and must be resized over many major collections. A more pressing problem is that the default maximum heap size is unreasonably small for most server applications. The rules of thumb for server applications are:
- Unless you have problems with pauses, try granting as much memory as possible to the virtual machine. The default size (64MB) is often too small.
- Setting
-Xmsand-Xmxto the same value increases predictability by removing the most important sizing decision from the virtual machine. However, the virtual machine is then unable to compensate if you make a poor choice. - In general, increase the memory as you increase the number of processors, since allocation can be parallelized.
For reference, there is a separate page explaining some of the available command-line options.
The Young Generation
The second most influential knob is the proportion of the heap dedicated to the young generation. The bigger the young generation, the less often minor collections occur. However, for a bounded heap size a larger young generation implies a smaller tenured generation, which will increase the frequency of major collections. The optimal choice depends on the lifetime distribution of the objects allocated by the application.
By default, the young generation size is controlled by NewRatio. For example, setting -XX:NewRatio=3 means that the ratio between the young and tenured generation is 1:3. In other words, the combined size of the eden and survivor spaces will be one fourth of the total heap size.
The parameters NewSize and MaxNewSize bound the young generation size from below and above. Setting these to the same value fixes the young generation, just as setting -Xms and -Xmx to the same value fixes the total heap size. This is useful for tuning the young generation at a finer granularity than the integral multiples allowed by NewRatio.
Survivor Space Sizing
If desired, the parameter SurvivorRatio can be used to tune the size of the survivor spaces, but this is often not as important for performance. For example, -XX:SurvivorRatio=6 sets the ratio between eden and a survivor space to 1:6. In other words, each survivor space will be one sixth the size of eden, and thus one eighth the size of the young generation (not one seventh, because there are two survivor spaces).
If survivor spaces are too small, copying collection overflows directly into the tenured generation. If survivor spaces are too large, they will be uselessly empty. At each garbage collection the virtual machine chooses a threshold number of times an object can be copied before it is tenured. This threshold is chosen to keep the survivors half full. The command-line option -XX:+PrintTenuringDistribution can be used to show this threshold and the ages of objects in the new generation. It is also useful for observing the lifetime distribution of an application.
Here are the default values for the 32-bit Solaris Operating System (SPARC Platform Edition); the default values on other platforms are different.
NewRatio |
8 |
2 |
NewSize |
2228K |
2228K |
MaxNewSize |
not limited |
not limited |
SurvivorRatio |
32 |
32 |
The maximum size of the young generation will be calculated from the maximum size of the total heap and NewRatio. The "not limited" default value for MaxNewSize means that the calculated value is not limited by MaxNewSize unless a value for MaxNewSize is specified on the command line.
The rules of thumb for server applications are:
- First decide the maximum heap size you can afford to give the virtual machine. Then plot your performance metric against young generation sizes to find the best setting.
- Note that the maximum heap size should always be smaller than the amount of memory installed on the machine, to avoid excessive page faults and thrashing.
- If the total heap size is fixed, increasing the young generation size requires reducing the tenured generation size. Keep the tenured generation large enough to hold all the live data used by the application at any given time, plus some amount of slack space (10-20% or more).
- Subject to the above constraint on the tenured generation:
- Grant plenty of memory to the young generation.
- Increase the young generation size as you increase the number of processors, since allocation can be parallelized.
5. Available Collectors
The discussion to this point has been about the serial collector. The Java HotSpot VM includes three different collectors, each with different performance characteristics.
- The serial collector uses a single thread to perform all garbage collection work, which makes it relatively efficient since there is no communication overhead between threads. It is best-suited to single processor machines, since it cannot take advantage of multiprocessor hardware, although it can be useful on multiprocessors for applications with small data sets (up to approximately 100MB). The serial collector is selected by default on certain hardware and operating system configurations, or can be explicitly enabled with the option
-XX:+UseSerialGC. - The parallel collector (also known as the throughput collector) performs minor collections in parallel, which can significantly reduce garbage collection overhead. It is intended for applications with medium- to large-sized data sets that are run on multiprocessor or multi-threaded hardware. The parallel collector is selected by default on certain hardware and operating system configurations, or can be explicitly enabled with the option
-XX:+UseParallelGC.-
New: parallel compaction is a feature introduced in J2SE 5.0 update 6 and enhanced in Java SE 6 that allows the parallel collector to perform major collections in parallel. Without parallel compaction, major collections are performed using a single thread, which can significantly limit scalability. Parallel compaction is enabled by adding the option
-XX:+UseParallelOldGCto the command line.
-
New: parallel compaction is a feature introduced in J2SE 5.0 update 6 and enhanced in Java SE 6 that allows the parallel collector to perform major collections in parallel. Without parallel compaction, major collections are performed using a single thread, which can significantly limit scalability. Parallel compaction is enabled by adding the option
- The concurrent collector performs most of its work concurrently (i.e., while the application is still running) to keep garbage collection pauses short. It is designed for applications with medium- to large-sized data sets for which response time is more important than overall throughput, since the techniques used to minimize pauses can reduce application performance. The concurrent collector is enabled with the option
-XX:+UseConcMarkSweepGC.
Selecting a Collector
Unless your application has rather strict pause time requirements, first run your application and allow the VM to select a collector. If necessary, adjust the heap size to improve performance. If the performance still does not meet your goals, then use the following guidelines as a starting point for selecting a collector.
- If the application has a small data set (up to approximately 100MB), then
- select the serial collector with
-XX:+UseSerialGC.
- select the serial collector with
- If the application will be run on a single processor and there are no pause time requirements, then
- let the VM select the collector, or
- select the serial collector with
-XX:+UseSerialGC.
- If (a) peak application performance is the first priority and (b) there are no pause time requirements or pauses of one second or longer are acceptable, then
- let the VM select the collector, or
- select the parallel collector with
-XX:+UseParallelGCand (optionally) enable parallel compaction with-XX:+UseParallelOldGC.
- If response time is more important than overall throughput and garbage collection pauses must be kept shorter than approximately one second, then
- select the concurrent collector with
-XX:+UseConcMarkSweepGC. If only one or two processors are available, consider using incremental mode, described below.
- select the concurrent collector with
| These guidelines provide only a starting point for selecting a collector because performance is dependent on the size of the heap, the amount of live data maintained by the application and the number and speed of available processors. Pause times are particularly sensitive to these factors, so the threshold of one second mentioned above is only approximate: the parallel collector will experience pause times longer than one second on many data size and hardware combinations; conversely, the concurrent collector may not be able to keep pauses shorter than one second on some combinations. |
If the recommended collector does not achieve the desired performance, first attempt to adjust the heap and generation sizes to meet the desired goals. If still unsuccessful, then try a different collector: use the concurrent collector to reduce pause times and use the parallel collector to increase overall throughput on multiprocessor hardware.
The Parallel Collector
The parallel collector (also referred to here as the throughput collector) is a generational collector similar to the serial collector; the primary difference is that multiple threads are used to speed up garbage collection. The parallel collector is enabled with the command line option -XX:+UseParallelGC. By default, only minor collections are executed in parallel; major collections are performed with a single thread. However, parallel compaction can be enabled with the option -XX:+UseParallelOldGC so that both minor and major collections are executed in parallel, to further reduce garbage collection overhead.
On a machine with N processors the parallel collector uses N garbage collector threads; however, this number can be adjusted with a command line option (see below). On a host with one processor, the parallel collector will likely not perform as well as the serial collector because of the overhead required for parallel execution (e.g., synchronization). However, when running applications with medium- to large-sized heaps, it generally outperforms the serial collector by a modest amount on machines with two processors, and usually performs significantly better than the serial collector when more than two processors are available.
The number of garbage collector threads can be controlled with the command line option -XX:ParallelGCThreads=<N>. If explicit tuning of the heap is being done with command line options, the size of the heap needed for good performance with the parallel collector is to first order the same as needed with the serial collector. Enabling the parallel collector should just make the minor collection pauses shorter. Because there are multiple garbage collector threads participating in the minor collection there is a small possibility of fragmentation due to promotions from the young generation to the tenured generation during the collection. Each garbage collection thread reserves a part of the tenured generation for promotions and the division of the available space into these "promotion buffers" can cause a fragmentation effect. Reducing the number of garbage collector threads will reduce this fragmentation effect as will increasing the size of the tenured generation.
Generations
As mentioned earlier, the arrangement of the generations is different in the parallel collector. That arrangement is shown in the figure below.

Ergonomics
Starting in J2SE 5.0, the parallel collector is selected by default on server-class machines as detailed in the document Garbage Collector Ergonomics. In addition, the parallel collector uses a method of automatic tuning that allows desired behaviors to be specified instead of generation sizes and other low-level tuning details. The behaviors that can be specified are:
- Maximum garbage collection pause time
- Throughput
- Footprint (i.e., heap size)
The maximum pause time goal is specified with the command line option -XX:MaxGCPauseMillis=<N>. This is interpreted as a hint that pause times of <N> milliseconds or less are desired; by default there is no maximum pause time goal. If a pause time goal is specified, the heap size and other garbage collection related parameters are adjusted in an attempt to keep garbage collection pauses shorter than the specified value. Note that these adjustments may cause the garbage collector to reduce the overall throughput of the application and in some cases the desired pause time goal cannot be met.
The throughput goal is measured in terms of the time spent doing garbage collection vs. the time spent outside of garbage collection (referred to as application time). The goal is specified by the command line option -XX:GCTimeRatio=<N>, which sets the ratio of garbage collection time to application time to 1 / (1 + <N>).
For example, -XX:GCTimeRatio=19 sets a goal of 1/20 or 5% of the total time in garbage collection. The default value is 99, resulting in a goal of 1% of the time in garbage collection.
Maxmimum heap footprint is specified using the existing option -Xmx<N>. In addition, the collector has an implicit goal of minimizing the size of the heap as long as the other goals are being met.
Priority of goals
The goals are addressed in the following order
- Maximum pause time goal
- Throughput goal
- Minimum footprint goal
The maximum pause time goal is met first. Only after it is met is the throughput goal addressed. Similarly, only after the first two goals have been met is the footprint goal considered.
Generation Size Adjustments
The statistics such as average pause time kept by the collector are updated at the end of each collection. The tests to determine if the goals have been met are then made and any needed adjustments to the size of a generation is made. The exception is that explicit garbage collections (e.g., calls to System.gc()) are ignored in terms of keeping statistics and making adjustments to the sizes of generations.
Growing and shrinking the size of a generation is done by increments that are a fixed percentage of the size of the generation so that a generation steps up or down toward its desired size. Growing and shrinking are done at different rates. By default a generation grows in increments of 20% and shrinks in increments of 5%. The percentage for growing is controlled by the command line flag -XX:YoungGenerationSizeIncrement=<Y> for the young generation and -XX:TenuredGenerationSizeIncrement=<T> for the tenured generation. The percentage by which a generation shrinks is adjusted by the command line flag -XX:AdaptiveSizeDecrementScaleFactor=<D>. If the growth increment is X percent, the decrement for shrinking is X / D percent.
If the collector decides to grow a generation at startup, there is a supplemental percentage added to the increment. This supplement decays with the number of collections and there is no long term affect of this supplement. The intent of the supplement is to increase startup performance. There is no supplement to the percentage for shrinking.
If the maximum pause time goal is not being met, the size of only one generation is shrunk at a time. If the pause times of both generations are above the goal, the size of the generation with the larger pause time is shrunk first.
If the throughput goal is not being met, the sizes of both generations are increased. Each is increased in proportion to its respective contribution to the total garbage collection time. For example, if the garbage collection time of the young generation is 25% of the total collection time and if a full increment of the young generation would be by 20%, then the young generation would be increased by 5%.
Default Heap Size
If not otherwise set on the command line, the initial and maximum heap sizes are calculated based on the amount of memory on the machine. The proportion of memory to use for the heap is controlled by the command line options DefaultInitialRAMFraction and DefaultMaxRAMFraction, as shown in the table below. (In the table, memory represents the amount of memory on the machine.)
| initial heap size | memory / DefaultInitialRAMFraction |
memory / 64 |
| maximum heap size | MIN(memory / DefaultMaxRAMFraction, 1GB) |
MIN(memory / 4, 1GB) |
Note that the default maximum heap size will not exceed 1GB, regardless of how much memory is installed on the machine.
Excessive GC Time and OutOfMemoryError
The parallel collector will throw an OutOfMemoryError if too much time is being spent in garbage collection: if more than 98% of the total time is spent in garbage collection and less than 2% of the heap is recovered, an OutOfMemoryError will be thrown. This feature is designed to prevent applications from running for an extended period of time while making little or no progress because the heap is too small. If necessary, this feature can be disabled by adding the option -XX:-UseGCOverheadLimit to the command line.
Measurements
The verbose garbage collector output from the parallel collector is essentially the same as that from the serial collector.
7. The Concurrent Collector
The concurrent collector is designed for applications that prefer shorter garbage collection pauses and that can afford to share processor resources with the garbage collector while the application is running. Typically applications which have a relatively large set of long-lived data (a large tenured generation), and run on machines with two or more processors tend to benefit from the use of this collector. However, this collector should be considered for any application with a low pause time requirement; for example, good results have been observed for interactive applications with tenured generations of a modest size on a single processor, especially if using incremental mode. The concurrent collector is enabled with the command line option -XX:+UseConcMarkSweepGC.
Similar to the other available collectors, the concurrent collector is generational; thus both minor and major collections occur. The concurrent collector attempts to reduce pause times due to major collections by using separate garbage collector threads to trace the reachable objects concurrently with the execution of the application threads. During each major collection cycle, the concurrent collector will pause all the application threads for a brief period at the beginning of the collection and again toward the middle of the collection. The second pause tends to be the longer of the two pauses and multiple threads are used to do the collection work during that pause. The remainder of the collection including the bulk of the tracing of live objects and sweeping of unreachable objects is done with one or more garbage collector threads that run concurrently with the application. Minor collections can interleave with an on-going major cycle, and are done in a manner similar to the parallel collector (in particular, the application threads are stopped during minor collections).
The basic algorithms used by the concurrent collector are described in the technical report A Generational Mostly-concurrent Garbage Collector. Note that precise implementation details may, however, differ slightly as the collector is enhanced from one release to another.
Overhead of Concurrency
The concurrent collector trades processor resources (which would otherwise be available to the application) for shorter major collection pause times. The most visible overhead is the use of one or more processors during the concurrent parts of the collection. On an N processor system, the concurrent part of the collection will use K/N of the available processors, where 1 <= K <= ceiling{N/4}. (Note that the precise choice of and bounds on K are subject to change.) In addition to the use of processors during concurrent phases, additional overhead is incurred to enable concurrency. Thus while garbage collection pauses are typically much shorter with the concurrent collector, application throughput also tends to be slightly lower than with the other collectors.
On a machine with more than one processing core, there are processors available for application threads during the concurrent part of the collection, so the concurrent garbage collector thread does not "pause" the application. This usually results in shorter pauses, but again fewer processor resources are available to the application and some slowdown should be expected, especially if the application utilizes all of the processing cores maximally. Up to a limit, as N increases the reduction in processor resources due to concurrent garbage collection becomes smaller, and the benefit from concurrent collection increases. The following section, concurrent mode failure, discusses potential limits to such scaling.
Since at least one processor is utilized for garbage collection during the concurrent phases, the concurrent collector does not normally provide any benefit on a uniprocessor (single-core) machine. However, there is a separate mode available that can achieve low pauses on systems with only one or two processors; see incremental mode below for details.
Concurrent Mode Failure
The concurrent collector uses one or more garbage collector threads that run simultaneously with the application threads with the goal of completing the collection of the tenured and permanent generations before either becomes full. As described above, in normal operation, the concurrent collector does most of its tracing and sweeping work with the application threads still running, so only brief pauses are seen by the application threads. However, if the concurrent collector is unable to finish reclaiming the unreachable objects before the tenured generation fills up, or if an allocation cannot be satisfied with the available free space blocks in the tenured generation, then the application is paused and the collection is completed with all the application threads stopped. The inability to complete a collection concurrently is referred to as concurrent mode failure and indicates the need to adjust the concurrent collector parameters.
Excessive GC Time and OutOfMemoryError
The concurrent collector will throw an OutOfMemoryError if too much time is being spent in garbage collection: if more than 98% of the total time is spent in garbage collection and less than 2% of the heap is recovered, an OutOfMemoryError will be thrown. This feature is designed to prevent applications from running for an extended period of time while making little or no progress because the heap is too small. If necessary, this feature can be disabled by adding the option -XX:-UseGCOverheadLimit to the command line.
The policy is the same as that in the parallel collector, except that time spent performing concurrent collections is not counted toward the 98% time limit. In other words, only collections performed while the application is stopped count toward excessive GC time. Such collections are typically due to a concurrent mode failure or an explicit collection request (e.g., a call to System.gc()). |
Floating Garbage
The concurrent collector, like all the other collectors in HotSpot, is a tracing collector that identifies at least all the reachable objects in the heap. In the parlance of Jones and Lins it is an incremental update collector. Because application threads and the garbage collector thread run concurrently during a major collection, objects that are traced by the garbage collector thread may subsequently become unreachable by the time collection finishes. Such unreachable objects that have not yet been reclaimed are referred to as floating garbage. The amount of floating garbage depends on the duration of the concurrent collection cycle and on the frequency of reference updates, also known as mutations, by the application. Furthermore, since the young generation and the tenured generation are collected independently, each acts a source of roots to the other. As a rough rule of thumb, try increasing the size of the tenured generation by 20% to account for the floating garbage. Floating garbage in the heap at the end of one concurrent collection cycle is collected during the next collection cycle.
Pauses
The concurrent collector pauses an application twice during a concurrent collection cycle. The first pause is to mark as live the objects directly reachable from the roots (e.g., object references from application thread stacks and registers, static objects and so on) and from elsewhere in the heap (e.g., the young generation). This first pause is referred to as the initial mark pause. The second pause comes at the end of the concurrent tracing phase and finds objects that were missed by the concurrent tracing due to updates by the application threads of references in an object after the concurrent collector had finished tracing that object. This second pause is referred to as the remark pause.
Concurrent Phases
The concurrent tracing of the reachable object graph occurs between the initial mark pause and the remark pause. During this concurrent tracing phase one or more concurrent garbage collector threads may be using processor resources that would otherwise have been available to the application and, as a result, compute-bound applications may see a commensurate fall in application throughput during this and other concurrent phases even though the application threads are not paused. After the remark pause, there is a concurrent sweeping phase which collects the objects identified as unreachable. Once a collection cycle completes, the concurrent collector will wait, consume almost no computational resources, until the start of the next major collection cycle.
Starting a Concurrent Collection Cycle
With the serial collector a major collection occurs whenever the tenured generation becomes full and all application threads are stopped while the collection is done. In contrast, a concurrent collection needs to be started at a time such that the collection can finish before the tenured generation becomes full; otherwise the application would observe longer pauses due to concurrent mode failure. There are several ways a concurrent collection can be started.
Based on recent history, the concurrent collector maintains estimates of the time remaining before the tenured generation will be exhausted and of the time needed for a concurrent collection cycle. Based on these dynamic estimates, a concurrent collection cycle will be started with the aim of completing the collection cycle before the tenured generation is exhausted. These estimates are padded for safety, since the concurrent mode failure can be very costly.
A concurrent collection will also start if the occupancy of the tenured generation exceeds an initiating occupancy, a percentage of the tenured generation. The default value of this initiating occupancy threshold is approximately 92%, but the value is subject to change from release to release. This value can be manually adjusted using the command line option
-XX:CMSInitiatingOccupancyFraction=<N> |
where <N> is an integral percentage (0-100) of the tenured generation size.
Scheduling Pauses
The pauses for the young generation collection and the tenured generation collection occur independently. They do not overlap, but may occur in quick succession such that the pause from one collection, immediately followed by one from the other collection, can appear to be a single, longer pause. To avoid this, the concurrent collector attempts to schedule the remark pause roughly midway between the previous and next young generation pauses. This scheduling is currently not done for the initial mark pause, which is usually much shorter than the remark pause.
Incremental Mode
The concurrent collector can be used in a mode in which the concurrent phases are done incrementally. Recall that during a concurrent phase the garbage collector thread is using one or more processors. The incremental mode is meant to lessen the impact of long concurrent phases by periodically stopping the concurrent phase to yield back the processor to the application. This mode, referred to here as “i-cms,” divides the work done concurrently by the collector into small chunks of time which are scheduled between young generation collections. This feature is useful when applications that need the low pause times provided by the concurrent collector are run on machines with small numbers of processors (e.g., 1 or 2).
The concurrent collection cycle typically includes the following steps:
- stop all application threads and identify the set of objects reachable from roots, then resume all application threads
- concurrently trace the reachable object graph, using one or more processors, while the application threads are executing
- concurrently retrace sections of the object graph that were modified since the tracing in the previous step, using one processor
- stop all application threads and retrace sections of the roots and object graph that may have been modified since they were last examined, then resume all application threads
- concurrently sweep up the unreachable objects to the free lists used for allocation, using one processor
- concurrently resize the heap and prepare the support data structures for the next collection cycle, using one processor
Normally, the concurrent collector uses one or more processors during the entire concurrent tracing phase, without voluntarily relinquishing them. Similarly, one processor is used for the entire concurrent sweep phase, again without relinquishing it. This overhead can be too much of a disruption for applications with response time constraints that might otherwise have utilized the processing cores, particularly when run on systems with just one or two processors. Incremental mode solves this problem by breaking up the concurrent phases into short bursts of activity, which are scheduled to occur mid-way between minor pauses.
i-cms uses a duty cycle to control the amount of work the concurrent collector is allowed to do before voluntarily giving up the processor. The duty cycle is the percentage of time between young generation collections that the concurrent collector is allowed to run. i-cms can automatically compute the duty cycle based on the behavior of the application (the recommended method, known as automatic pacing), or the duty cycle can be set to a fixed value on the command line.
Command Line Options
The following command-line options control i-cms (see below for recommendations for an initial set of options):
| -XX:+CMSIncrementalMode | Enables incremental mode. Note that the concurrent collector must also be enabled (with -XX:+UseConcMarkSweepGC) for this option to work. | disabled | disabled |
| -XX:+CMSIncrementalPacing | Enables automatic pacing. The incremental mode duty cycle is automatically adjusted based on statistics collected while the JVM is running. | disabled | enabled |
| -XX:CMSIncrementalDutyCycle=<N> | The percentage (0-100) of time between minor collections that the concurrent collector is allowed to run. If CMSIncrementalPacing is enabled, then this is just the initial value. | 50 | 10 |
| -XX:CMSIncrementalDutyCycleMin=<N> | The percentage (0-100) which is the lower bound on the duty cycle when CMSIncrementalPacing is enabled. | 10 | 0 |
| -XX:CMSIncrementalSafetyFactor=<N> | The percentage (0-100) used to add conservatism when computing the duty cycle. | 10 | 10 |
| -XX:CMSIncrementalOffset=<N> | The percentage (0-100) by which the incremental mode duty cycle is shifted to the right within the period between minor collections. | 0 | 0 |
| -XX:CMSExpAvgFactor=<N> | The percentage (0-100) used to weight the current sample when computing exponential averages for the concurrent collection statistics. | 25 | 25 |
Recommended Options
To use i-cms in Java SE 6, use the following command line options:
-XX:+UseConcMarkSweepGC -XX:+CMSIncrementalMode \


-XX:+PrintGCDetails -XX:+PrintGCTimeStamps
|
The first two options enable the concurrent collector and i-cms, respectively. The last two options are not required; they simply cause diagnostic information about garbage collection to be written to stdout, so that garbage collection behavior can be seen and later analyzed.
Note that in J2SE 5.0 and earlier releases, we recommend the following as an initial set of command line options for i-cms:
-XX:+UseConcMarkSweepGC -XX:+CMSIncrementalMode \


-XX:+PrintGCDetails -XX:+PrintGCTimeStamps \


-XX:+CMSIncrementalPacing -XX:CMSIncrementalDutyCycleMin=0


-XX:CMSIncrementalDutyCycle=10
|
These are the same as recommended for Java SE 6, with the addition of three options that control i-cms automatic pacing. The additional options simply specify the values that became the default in Java SE 6.
Basic Troubleshooting
The i-cms automatic pacing feature uses statistics gathered while the program is running to compute a duty cycle so that concurrent collections complete before the heap becomes full. However, past behavior is not a perfect predictor of future behavior and the estimates may not always be accurate enough to prevent the heap from becoming full. If too many full collections occur, try the following steps, one at a time:
| 1. Increase the safety factor: | -XX:CMSIncrementalSafetyFactor=<N> |
| 2. Increase the minimum duty cycle: | -XX:CMSIncrementalDutyCycleMin=<N> |
| 3. Disable automatic pacing and use a fixed duty cycle: | -XX:-CMSIncrementalPacing -XX:CMSIncrementalDutyCycle=<N> |
Measurements
Below is the output from the concurrent collector with the options -verbose:gc -XX:+PrintGCDetails, with a few minor details removed. Note that the output for the concurrent collector is interspersed with the output from the minor collections; typically many minor collections occur during a concurrent collection cycle. TheCMS-initial-mark:indicates the start of the concurrent collection cycle. TheCMS-concurrent-mark:indicates the end of the concurrent marking phase andCMS-concurrent-sweep:marks the end of the concurrent sweeping phase. Not discussed before is the precleaning phase indicated byCMS-concurrent-preclean:. Precleaning represents work that can be done concurrently in preparation for the remark phaseCMS-remark. The final phase is indicated by theCMS-concurrent-reset:and is in preparation for the next concurrent collection.
[GC [1 CMS-initial-mark: 13991K(20288K)] 14103K(22400K), 0.0023781 secs]
[GC [DefNew: 2112K->64K(2112K), 0.0837052 secs] 16103K->15476K(22400K), 0.0838519 secs]
...
[GC [DefNew: 2077K->63K(2112K), 0.0126205 secs] 17552K->15855K(22400K), 0.0127482 secs]
[CMS-concurrent-mark: 0.267/0.374 secs]
[GC [DefNew: 2111K->64K(2112K), 0.0190851 secs] 17903K->16154K(22400K), 0.0191903 secs]
[CMS-concurrent-preclean: 0.044/0.064 secs]
[GC [1 CMS-remark: 16090K(20288K)] 17242K(22400K), 0.0210460 secs]
[GC [DefNew: 2112K->63K(2112K), 0.0716116 secs] 18177K->17382K(22400K), 0.0718204 secs]
[GC [DefNew: 2111K->63K(2112K), 0.0830392 secs] 19363K->18757K(22400K), 0.0832943 secs]
...
[GC [DefNew: 2111K->0K(2112K), 0.0035190 secs] 17527K->15479K(22400K), 0.0036052 secs]
[CMS-concurrent-sweep: 0.291/0.662 secs]
[GC [DefNew: 2048K->0K(2112K), 0.0013347 secs] 17527K->15479K(27912K), 0.0014231 secs]
[CMS-concurrent-reset: 0.016/0.016 secs]
[GC [DefNew: 2048K->1K(2112K), 0.0013936 secs] 17527K->15479K(27912K), 0.0014814 secs]
The initial mark pause is typically short relative to the minor collection pause time. The concurrent phases (concurrent mark, concurrent preclean and concurrent sweep) normally last significantly longer than a minor collection pause, as indicated by the example output above. Note, however, that the application is not paused during these concurrent phases. The remark pause is often comparable in length to a minor collection. The remark pause is affected by certain application characteristics (e.g., a high rate of object modification can increase this pause) and the time since the last minor collection (i.e., more objects in the young generation may increase this pause).
8. Other Considerations
Permanent Generation Size
The permanent generation does not have a noticeable impact on garbage collector performance for most applications. However, some applications dynamically generate and load many classes; for example, some implementations of JavaServer Pages (JSP) pages. These applications may need a larger permanent generation to hold the additional classes. If so, the maximum permanent generation size can be increased with the command-line option -XX:MaxPermSize=<N>.
Finalization; Weak, Soft and Phantom References
Some applications interact with garbage collection by using finalization and weak, soft, or phantom references. These features can create performance artifacts at the Java programming language level. An example of this is relying on finalization to close file descriptors, which makes an external resource (descriptors) dependent on garbage collection promptness. Relying on garbage collection to manage resources other than memory is almost always a bad idea.
The Resources section includes an article that discusses in depth some of the pitfalls of finalization and techniques for avoiding them.
Explicit Garbage Collection
Another way applications can interact with garbage collection is by invoking full garbage collections explicitly by calling System.gc(). This can force a major collection to be done when it may not be necessary (i.e., when a minor collection would suffice), and so in general should be avoided. The performance impact of explicit garbage collections can be measured by disabling them using the flag -XX:+DisableExplicitGC, which causes the VM to ignore calls to System.gc().
One of the most commonly encountered uses of explicit garbage collection occurs with RMI's distributed garbage collection (DGC). Applications using RMI refer to objects in other virtual machines. Garbage cannot be collected in these distributed applications without occasionally collection the local heap, so RMI forces full collections periodically. The frequency of these collections can be controlled with properties. For example,
java -Dsun.rmi.dgc.client.gcInterval=3600000 -Dsun.rmi.dgc.server.gcInterval=3600000 ... |
specifies explicit collection once per hour instead of the default rate of once per minute. However, this may also cause some objects to take much longer to be reclaimed. These properties can be set as high as Long.MAX_VALUE to make the time between explicit collections effectively infinite, if there is no desire for an upper bound on the timeliness of DGC activity.
Soft References
Soft references are kept alive longer in the server virtual machine than in the client. The rate of clearing can be controlled with the command line option -XX:SoftRefLRUPolicyMSPerMB=<N>, which specifies the number of milliseconds a soft reference will be kept alive (once it is no longer strongly reachable) for each megabyte of free space in the heap. The default value is 1000 ms per megabyte, which means that a soft reference will survive (after the last strong reference to the object has been collected) for 1 second for each megabyte of free space in the heap. Note that this is an approximate figure since soft references are cleared only during garbage collection, which may occur sporadically.
Solaris 8 Alternate libthread
The Solaris 8 Operating System supports an alternate version of the threading library, libthread, that binds threads to light-weight processes (LWPs) directly. Some applications can benefit greatly from the use of this alternate libthread and it is a potential benefit for any threaded application. The following commands will load the alternate libthread for java (Bourne shell syntax is shown):
LD_PRELOAD=/usr/lib/lwp/libthread.so.1 export LD_PRELOAD java ... |
The above is necessary only on Solaris 8, since the alternate libthread is the default in the Solaris 9 Operating System and is the only libthread available starting with Solaris 10.
9. Resources
- HotSpot VM Frequently Asked Questions (FAQ)
- GC output examples describes how to interpret the output from the different collectors.
- How to Handle Java Finalization's Memory-Retention Issues covers finalization pitfalls and ways to avoid them.
- Richard Jones and Rafael Lins, Garbage Collection: Algorithms for Automated Dynamic Memory Management, Wiley and Sons (1996), ISBN 0-471-94148-4
As used on the web site, the terms "Java Virtual Machine" and "JVM" mean a virtual machine for the Java platform.


相关推荐
Java虚拟机(JVM)是Java...阅读“java hotspot vm options.pdf”、“java se 6 hotspot[tm] virtual machine garbage collection tuning.pdf”和“java工具选项文档.pdf”等资料,将有助于深入学习和实践这些知识。
内容概要:本文探讨了模糊故障树(FFTA)在工业控制系统可靠性分析中的应用,解决了传统故障树方法无法处理不确定数据的问题。文中介绍了模糊数的基本概念和实现方式,如三角模糊数和梯形模糊数,并展示了如何用Python实现模糊与门、或门运算以及系统故障率的计算。此外,还详细讲解了最小割集的查找方法、单元重要度的计算,并通过实例说明了这些方法的实际应用场景。最后,讨论了模糊运算在处理语言变量方面的优势,强调了在可靠性分析中处理模糊性和优化计算效率的重要性。 适合人群:从事工业控制系统设计、维护的技术人员,以及对模糊数学和可靠性分析感兴趣的科研人员。 使用场景及目标:适用于需要评估复杂系统可靠性的场合,特别是在面对不确定数据时,能够提供更准确的风险评估。目标是帮助工程师更好地理解和预测系统故障,从而制定有效的预防措施。 其他说明:文中提供的代码片段和方法可用于初步方案验证和技术探索,但在实际工程项目中还需进一步优化和完善。
内容概要:本文详细探讨了双馈风力发电机(DFIG)在Simulink环境下的建模方法及其在不同风速条件下的电流与电压波形特征。首先介绍了DFIG的基本原理,即定子直接接入电网,转子通过双向变流器连接电网的特点。接着阐述了Simulink模型的具体搭建步骤,包括风力机模型、传动系统模型、DFIG本体模型和变流器模型的建立。文中强调了变流器控制算法的重要性,特别是在应对风速变化时,通过实时调整转子侧的电压和电流,确保电流和电压波形的良好特性。此外,文章还讨论了模型中的关键技术和挑战,如转子电流环控制策略、低电压穿越性能、直流母线电压脉动等问题,并提供了具体的解决方案和技术细节。最终,通过对故障工况的仿真测试,验证了所建模型的有效性和优越性。 适用人群:从事风力发电研究的技术人员、高校相关专业师生、对电力电子控制系统感兴趣的工程技术人员。 使用场景及目标:适用于希望深入了解DFIG工作原理、掌握Simulink建模技能的研究人员;旨在帮助读者理解DFIG在不同风速条件下的动态响应机制,为优化风力发电系统的控制策略提供理论依据和技术支持。 其他说明:文章不仅提供了详细的理论解释,还附有大量Matlab/Simulink代码片段,便于读者进行实践操作。同时,针对一些常见问题给出了实用的调试技巧,有助于提高仿真的准确性和可靠性。
内容概要:本文详细介绍了基于西门子S7-200 PLC和组态王软件构建的八层电梯控制系统。首先阐述了系统的硬件配置,包括PLC的IO分配策略,如输入输出信号的具体分配及其重要性。接着深入探讨了梯形图编程逻辑,涵盖外呼信号处理、轿厢运动控制以及楼层判断等关键环节。随后讲解了组态王的画面设计,包括动画效果的实现方法,如楼层按钮绑定、轿厢移动动画和门开合效果等。最后分享了一些调试经验和注意事项,如模拟困人场景、防抖逻辑、接线艺术等。 适合人群:从事自动化控制领域的工程师和技术人员,尤其是对PLC编程和组态软件有一定基础的人群。 使用场景及目标:适用于需要设计和实施小型电梯控制系统的工程项目。主要目标是帮助读者掌握PLC编程技巧、组态画面设计方法以及系统联调经验,从而提高项目的成功率。 其他说明:文中提供了详细的代码片段和调试技巧,有助于读者更好地理解和应用相关知识点。此外,还强调了安全性和可靠性方面的考量,如急停按钮的正确接入和硬件互锁设计等。
内容概要:本文介绍了如何将CarSim的动力学模型与Simulink的智能算法相结合,利用模型预测控制(MPC)实现车辆的智能超车换道。主要内容包括MPC控制器的设计、路径规划算法、联合仿真的配置要点以及实际应用效果。文中提供了详细的代码片段和技术细节,如权重矩阵设置、路径跟踪目标函数、安全超车条件判断等。此外,还强调了仿真过程中需要注意的关键参数配置,如仿真步长、插值设置等,以确保系统的稳定性和准确性。 适合人群:从事自动驾驶研究的技术人员、汽车工程领域的研究人员、对联合仿真感兴趣的开发者。 使用场景及目标:适用于需要进行自动驾驶车辆行为模拟的研究机构和企业,旨在提高超车换道的安全性和效率,为自动驾驶技术研发提供理论支持和技术验证。 其他说明:随包提供的案例文件已调好所有参数,可以直接导入并运行,帮助用户快速上手。文中提到的具体参数和配置方法对于初学者非常友好,能够显著降低入门门槛。
包括:源程序工程文件、Proteus仿真工程文件、论文材料、配套技术手册等 1、采用51单片机作为主控; 2、采用AD0809(仿真0808)检测"PH、氨、亚硝酸盐、硝酸盐"模拟传感; 3、采用DS18B20检测温度; 4、采用1602液晶显示检测值; 5、检测值同时串口上传,调试助手监看; 6、亦可通过串口指令对加热器、制氧机进行控制;
内容概要:本文详细介绍了双馈永磁风电机组并网仿真模型及其短路故障分析方法。首先构建了一个9MW风电场模型,由6台1.5MW双馈风机构成,通过升压变压器连接到120kV电网。文中探讨了风速模块的设计,包括渐变风、阵风和随疾风的组合形式,并提供了相应的Python和MATLAB代码示例。接着讨论了双闭环控制策略,即功率外环和电流内环的具体实现细节,以及MPPT控制用于最大化风能捕获的方法。此外,还涉及了短路故障模块的建模,包括三相电压电流特性和离散模型与phasor模型的应用。最后,强调了永磁同步机并网模型的特点和注意事项。 适合人群:从事风电领域研究的技术人员、高校相关专业师生、对风电并网仿真感兴趣的工程技术人员。 使用场景及目标:适用于风电场并网仿真研究,帮助研究人员理解和优化风电机组在不同风速条件下的性能表现,特别是在短路故障情况下的应对措施。目标是提高风电系统的稳定性和可靠性。 其他说明:文中提供的代码片段和具体参数设置有助于读者快速上手并进行实验验证。同时提醒了一些常见的错误和需要注意的地方,如离散化步长的选择、初始位置对齐等。
适用于空手道训练和测试场景
内容概要:本文介绍了金牌音乐作词大师的角色设定、背景经历、偏好特点、创作目标、技能优势以及工作流程。金牌音乐作词大师凭借深厚的音乐文化底蕴和丰富的创作经验,能够为不同风格的音乐创作歌词,擅长将传统文化元素与现代流行文化相结合,创作出既富有情感又触动人心的歌词。在创作过程中,会严格遵守社会主义核心价值观,尊重用户需求,提供专业修改建议,确保歌词内容健康向上。; 适合人群:有歌词创作需求的音乐爱好者、歌手或音乐制作人。; 使用场景及目标:①为特定主题或情感创作歌词,如爱情、励志等;②融合传统与现代文化元素创作独特风格的歌词;③对已有歌词进行润色和优化。; 阅读建议:阅读时可以重点关注作词大师的创作偏好、技能优势以及工作流程,有助于更好地理解如何创作出高质量的歌词。同时,在提出创作需求时,尽量详细描述自己的情感背景和期望,以便获得更贴合心意的作品。
linux之用户管理教程.md
包括:源程序工程文件、Proteus仿真工程文件、配套技术手册等 1、采用51/52单片机作为主控芯片; 2、采用1602液晶显示设置及状态; 3、采用L298驱动两个电机,模拟机械臂动力、移动底盘动力; 3、首先按键配置-待搬运物块的高度和宽度(为0不能开始搬运); 4、按下启动键开始搬运,搬运流程如下: 机械臂先把物块抓取到机器车上, 机械臂减速 机器车带着物块前往目的地 机器车减速 机械臂把物块放下来 机械臂减速 机器车回到物块堆积处(此时机器车是空车) 机器车减速 蜂鸣器提醒 按下复位键,结束本次搬运
内容概要:本文详细介绍了基于下垂控制的三相逆变器电压电流双闭环控制的仿真方法及其在MATLAB/Simulink和PLECS中的具体实现。首先解释了下垂控制的基本原理,即有功调频和无功调压,并给出了相应的数学表达式。随后讨论了电压环和电流环的设计与参数整定,强调了两者带宽的差异以及PI控制器的参数选择。文中还提到了一些常见的调试技巧,如锁相环的响应速度、LC滤波器的谐振点处理、死区时间设置等。此外,作者分享了一些实用的经验,如避免过度滤波、合理设置采样周期和下垂系数等。最后,通过突加负载测试展示了系统的动态响应性能。 适合人群:从事电力电子、微电网研究的技术人员,尤其是有一定MATLAB/Simulink和PLECS使用经验的研发人员。 使用场景及目标:适用于希望深入了解三相逆变器下垂控制机制的研究人员和技术人员,旨在帮助他们掌握电压电流双闭环控制的具体实现方法,提高仿真的准确性和效率。 其他说明:本文不仅提供了详细的理论讲解,还结合了大量的实战经验和调试技巧,有助于读者更好地理解和应用相关技术。
内容概要:本文详细介绍了光伏并网逆变器的全栈开发资料,涵盖了从硬件设计到控制算法的各个方面。首先,文章深入探讨了功率接口板的设计,包括IGBT缓冲电路、PCB布局以及EMI滤波器的具体参数和设计思路。接着,重点讲解了主控DSP板的核心控制算法,如MPPT算法的实现及其注意事项。此外,还详细描述了驱动扩展板的门极驱动电路设计,特别是光耦隔离和驱动电阻的选择。同时,文章提供了并联仿真的具体实现方法,展示了环流抑制策略的效果。最后,分享了许多宝贵的实战经验和调试技巧,如主变压器绕制、PWM输出滤波、电流探头使用等。 适合人群:从事电力电子、光伏系统设计的研发工程师和技术爱好者。 使用场景及目标:①帮助工程师理解和掌握光伏并网逆变器的硬件设计和控制算法;②提供详细的实战经验和调试技巧,提升产品的可靠性和性能;③适用于希望深入了解光伏并网逆变器全栈开发的技术人员。 其他说明:文中不仅提供了具体的电路设计和代码实现,还分享了许多宝贵的实际操作经验和常见问题的解决方案,有助于提高开发效率和产品质量。
内容概要:本文详细介绍了粒子群优化(PSO)算法与3-5-3多项式相结合的方法,在机器人轨迹规划中的应用。首先解释了粒子群算法的基本原理及其在优化轨迹参数方面的作用,随后阐述了3-5-3多项式的数学模型,特别是如何利用不同阶次的多项式确保轨迹的平滑过渡并满足边界条件。文中还提供了具体的Python代码实现,展示了如何通过粒子群算法优化时间分配,使3-5-3多项式生成的轨迹达到时间最优。此外,作者分享了一些实践经验,如加入惩罚项以避免超速,以及使用随机扰动帮助粒子跳出局部最优。 适合人群:对机器人运动规划感兴趣的科研人员、工程师和技术爱好者,尤其是有一定编程基础并对优化算法有初步了解的人士。 使用场景及目标:适用于需要精确控制机器人运动的应用场合,如工业自动化生产线、无人机导航等。主要目标是在保证轨迹平滑的前提下,尽可能缩短运动时间,提高工作效率。 其他说明:文中不仅给出了理论讲解,还有详细的代码示例和调试技巧,便于读者理解和实践。同时强调了实际应用中需要注意的问题,如系统的建模精度和安全性考量。
KUKA机器人相关资料
内容概要:本文详细探讨了光子晶体中的束缚态在连续谱中(BIC)及其与轨道角动量(OAM)激发的关系。首先介绍了光子晶体的基本概念和BIC的独特性质,随后展示了如何通过Python代码模拟二维光子晶体中的BIC,并解释了BIC在光学器件中的潜在应用。接着讨论了OAM激发与BIC之间的联系,特别是BIC如何增强OAM激发效率。文中还提供了使用有限差分时域(FDTD)方法计算OAM的具体步骤,并介绍了计算本征态和三维Q值的方法。此外,作者分享了一些实验中的有趣发现,如特定条件下BIC表现出OAM特征,以及不同参数设置对Q值的影响。 适合人群:对光子晶体、BIC和OAM感兴趣的科研人员和技术爱好者,尤其是从事微纳光子学研究的专业人士。 使用场景及目标:适用于希望通过代码模拟深入了解光子晶体中BIC和OAM激发机制的研究人员。目标是掌握BIC和OAM的基础理论,学会使用Python和其他工具进行模拟,并理解这些现象在实际应用中的潜力。 其他说明:文章不仅提供了详细的代码示例,还分享了许多实验心得和技巧,帮助读者避免常见错误,提高模拟精度。同时,强调了物理离散化方式对数值计算结果的重要影响。
内容概要:本文详细介绍了如何使用C#和Halcon 17.12构建一个功能全面的工业视觉项目。主要内容涵盖项目配置、Halcon脚本的选择与修改、相机调试、模板匹配、生产履历管理、历史图像保存以及与三菱FX5U PLC的以太网通讯。文中不仅提供了具体的代码示例,还讨论了实际项目中常见的挑战及其解决方案,如环境配置、相机控制、模板匹配参数调整、PLC通讯细节、生产数据管理和图像存储策略等。 适合人群:从事工业视觉领域的开发者和技术人员,尤其是那些希望深入了解C#与Halcon结合使用的专业人士。 使用场景及目标:适用于需要开发复杂视觉检测系统的工业应用场景,旨在提高检测精度、自动化程度和数据管理效率。具体目标包括但不限于:实现高效的视觉处理流程、确保相机与PLC的无缝协作、优化模板匹配算法、有效管理生产和检测数据。 其他说明:文中强调了框架整合的重要性,并提供了一些实用的技术提示,如避免不同版本之间的兼容性问题、处理实时图像流的最佳实践、确保线程安全的操作等。此外,还提到了一些常见错误及其规避方法,帮助开发者少走弯路。
内容概要:本文探讨了分布式电源(DG)接入对9节点配电网节点电压的影响。首先介绍了9节点配电网模型的搭建方法,包括定义节点和线路参数。然后,通过在特定节点接入分布式电源,利用Matlab进行潮流计算,模拟DG对接入点及其周围节点电压的影响。最后,通过绘制电压波形图,直观展示了不同DG容量和接入位置对配电网电压分布的具体影响。此外,还讨论了电压越限问题以及不同线路参数对电压波动的影响。 适合人群:电力系统研究人员、电气工程学生、从事智能电网和分布式能源研究的专业人士。 使用场景及目标:适用于研究分布式电源接入对配电网电压稳定性的影响,帮助优化分布式电源的规划和配置,确保电网安全稳定运行。 其他说明:文中提供的Matlab代码和图表有助于理解和验证理论分析,同时也为后续深入研究提供了有价值的参考资料。
内容概要:本文探讨了在两级电力市场环境中,针对省间交易商的最优购电模型的研究。文中提出了一个双层非线性优化模型,用于处理省内电力市场和省间电力交易的出清问题。该模型采用CVaR(条件风险价值)方法来评估和管理由新能源和负荷不确定性带来的风险。通过KKT条件和对偶理论,将复杂的双层非线性问题转化为更易求解的线性单层问题。此外,还通过实际案例验证了模型的有效性,展示了不同风险偏好设置对购电策略的影响。 适合人群:从事电力系统规划、运营以及风险管理的专业人士,尤其是对电力市场机制感兴趣的学者和技术专家。 使用场景及目标:适用于希望深入了解电力市场运作机制及其风险控制手段的研究人员和技术开发者。主要目标是为省间交易商提供一种科学有效的购电策略,以降低风险并提高经济效益。 其他说明:文章不仅介绍了理论模型的构建过程,还包括具体的数学公式推导和Python代码示例,便于读者理解和实践。同时强调了模型在实际应用中存在的挑战,如数据精度等问题,并指出了未来改进的方向。
内容概要:本文详细介绍了一套成熟的西门子1200 PLC轴运动控制程序模板,涵盖多轴伺服控制、电缸控制、PLC通讯、气缸报警块、完整电路图、威纶通触摸屏程序和IO表等方面的内容。该模板已在多个项目中成功应用,如海康威视的路由器外壳装配机,确保了系统的稳定性和可靠性。文中不仅提供了具体的代码示例,还分享了许多实战经验和技巧,如参数设置、异常处理机制、通讯优化等。 适合人群:从事工业自动化领域的工程师和技术人员,尤其是那些需要进行PLC编程和轴运动控制的从业者。 使用场景及目标:适用于需要快速搭建稳定可靠的PLC控制系统的企业和个人开发者。通过学习和应用该模板,可以提高开发效率,减少调试时间和错误发生率,从而更好地满足项目需求。 其他说明:文章强调了程序模板的实用性,特别是在异常处理和参数配置方面的独特设计,能够有效应对复杂的工业环境挑战。此外,还提到了一些常见的陷阱和解决方案,帮助读者避开常见错误,顺利实施项目。